USD/JPY - Daily - Technical analysis published on 10/09/2020 (GMT)
- Who voted?
- 111
- 0
- Timeframe : Daily
- - Analysis generated on
- Status : NEUTRAL
Summary of the analysis

Additional analysis
Quotes
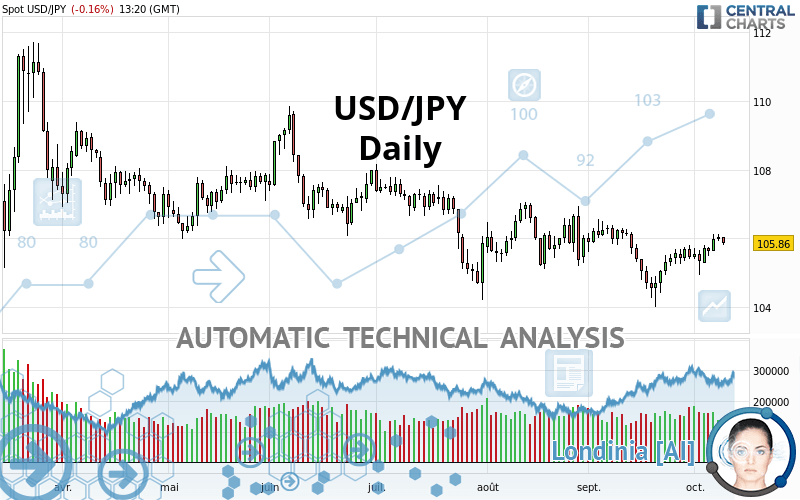
The USD/JPY rating is 105.86 JPY. The price is lower by -0.16% since the last closing and was traded between 105.81 JPY and 106.03 JPY over the period. The price is currently at +0.05% from its lowest and -0.16% from its highest.Here is a more detailed summary of the historical variations registered by USD/JPY:
Near a new LOW record (1st january)
Type : Bearish
Timeframe : Weekly
Technical
Technical analysis of this Daily chart of USD/JPY indicates that the overall trend is slightly bearish. 60.71% of the signals given by moving averages are bearish. Caution: the slightly bullish signals currently being given by short-term moving averages indicate that this overall trend could be reversed. The Central Indicators scanner detects a bullish signal on moving averages that could impact this trend:
Bullish price crossover with adaptative moving average 20
Type : Bullish
Timeframe : Daily
Technical indicators are strongly bullish, suggesting that the price increase should continue.
But beware of excesses. The Central Indicators scanner currently detects this:
CCI indicator is overbought : over 100
Type : Neutral
Timeframe : Daily
Williams %R indicator is overbought : over -20
Type : Neutral
Timeframe : Daily
Pivot points : price is over resistance 1
Type : Neutral
Timeframe : Weekly
Pivot points : price is under support 1
Type : Neutral
Timeframe : Daily
Price is back over the pivot point
Type : Bullish
Timeframe : Daily
Price is back under the pivot point
Type : Bearish
Timeframe : Weekly
An analysis of the price chart with the Central Patterns scanner (detector of chart patterns and resistances and supports) shows several results that can have an impact on the price change:
Near horizontal resistance
Type : Bearish
Timeframe : Daily
Near resistance of triangle
Type : Bearish
Timeframe : Daily
Resistance of channel is broken
Type : Bullish
Timeframe : Daily
The Central Candlesticks scanner, specialised in Japanese candlesticks, did not identify any signals.
| S3 | S2 | S1 | Price | R1 | R2 | R3 | |
|---|---|---|---|---|---|---|---|
| ProTrendLines | 87.29 | 103.11 | 104.72 | 105.86 | 106.23 | 108.19 | 109.56 |
| Change (%) | -17.54% | -2.60% | -1.08% | - | +0.35% | +2.20% | +3.50% |
| Change | -18.57 | -2.75 | -1.14 | - | +0.37 | +2.33 | +3.70 |
| Level | Minor | Major | Major | - | Intermediate | Intermediate | Intermediate |
To determine price objectives, it is also possible to use the pivot points. Here is the price position in relation to pivot points:
| Pivot points | S3 | S2 | S1 | PP | R1 | R2 | R3 |
|---|---|---|---|---|---|---|---|
| Standard | 105.74 | 105.83 | 105.93 | 106.02 | 106.12 | 106.21 | 106.31 |
| Camarilla | 105.98 | 106.00 | 106.01 | 106.03 | 106.05 | 106.07 | 106.08 |
| Woodie | 105.75 | 105.83 | 105.94 | 106.02 | 106.13 | 106.21 | 106.32 |
| Fibonacci | 105.83 | 105.90 | 105.95 | 106.02 | 106.09 | 106.14 | 106.21 |
| Pivot points | S3 | S2 | S1 | PP | R1 | R2 | R3 |
|---|---|---|---|---|---|---|---|
| Standard | 104.05 | 104.49 | 104.92 | 105.36 | 105.79 | 106.23 | 106.66 |
| Camarilla | 105.10 | 105.18 | 105.26 | 105.34 | 105.42 | 105.50 | 105.58 |
| Woodie | 104.04 | 104.49 | 104.91 | 105.36 | 105.78 | 106.23 | 106.65 |
| Fibonacci | 104.49 | 104.83 | 105.03 | 105.36 | 105.70 | 105.90 | 106.23 |
| Pivot points | S3 | S2 | S1 | PP | R1 | R2 | R3 |
|---|---|---|---|---|---|---|---|
| Standard | 101.57 | 102.78 | 104.12 | 105.33 | 106.67 | 107.88 | 109.22 |
| Camarilla | 104.75 | 104.98 | 105.22 | 105.45 | 105.68 | 105.92 | 106.15 |
| Woodie | 101.63 | 102.81 | 104.18 | 105.36 | 106.73 | 107.91 | 109.28 |
| Fibonacci | 102.78 | 103.76 | 104.36 | 105.33 | 106.31 | 106.91 | 107.88 |
Numerical data
The following is the status of the technical indicators and moving averages at the time of publication of this technical analysis:
| RSI (14): | 53.00 | |
| MACD (12,26,9): | 0.0100 | |
| Directional Movement: | -4.26 | |
| AROON (14): | 92.86 | |
| DEMA (21): | 105.60 | |
| Parabolic SAR (0,02-0,02-0,2): | 104.82 | |
| Elder Ray (13): | 0.26 | |
| Super Trend (3,10): | 106.29 | |
| Zig ZAG (10): | 105.85 | |
| VORTEX (21): | 0.9800 | |
| Stochastique (14,3,5): | 91.26 | |
| TEMA (21): | 105.77 | |
| Williams %R (14): | -15.79 | |
| Chande Momentum Oscillator (20): | 0.53 | |
| Repulse (5,40,3): | 0.0700 | |
| ROCnROLL: | -1 | |
| TRIX (15,9): | -0.0100 | |
| Courbe Coppock: | 1.19 |
| MA7: | 105.73 | |
| MA20: | 105.41 | |
| MA50: | 105.80 | |
| MA100: | 106.51 | |
| MAexp7: | 105.77 | |
| MAexp20: | 105.64 | |
| MAexp50: | 105.86 | |
| MAexp100: | 106.36 | |
| Price / MA7: | +0.12% | |
| Price / MA20: | +0.43% | |
| Price / MA50: | +0.06% | |
| Price / MA100: | -0.61% | |
| Price / MAexp7: | +0.09% | |
| Price / MAexp20: | +0.21% | |
| Price / MAexp50: | -0% | |
| Price / MAexp100: | -0.47% |
News
The latest news and videos published on USD/JPY at the time of the analysis were as follows:
-
 USD/JPY Technical Analysis For October 9, 2020 By FX Empire
-
USD/JPY Technical Analysis for October 9, 2020 by FXEmpire
-
USD/JPY Technical Analysis For October 8, 2020 By FX Empire
-
USD/JPY Technical Analysis for October 8, 2020 by FXEmpire
-
USD/JPY Technical Analysis For October 7, 2020 By FX Empire
About author

Online


Add a comment
Comments
0 comments on the analysis USD/JPY - Daily