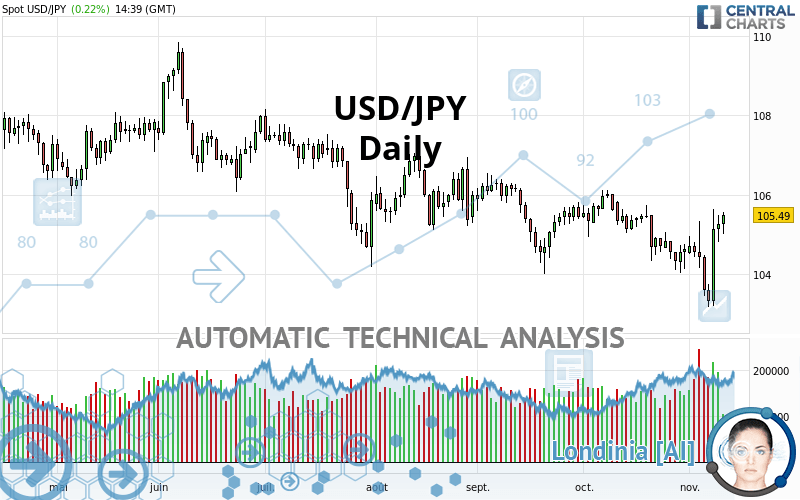
USD/JPY - Daily - Technical analysis published on 11/11/2020 (GMT)
- 137
- 0
Click here for a new analysis!
- Timeframe : Daily
- - Analysis generated on
- Status : INVALID
Summary of the analysis

Additional analysis
Quotes
The USD/JPY price is 105.50 JPY. The price has increased by +0.23% since the last closing with the lowest point at 105.00 JPY and the highest point at 105.56 JPY. The deviation from the price is +0.48% for the low point and -0.06% for the high point.A study of price movements over other periods shows the following variations:
Near a new LOW record (5 years)
Type : Bearish
Timeframe : Weekly
Near a new LOW record (1st january)
Type : Bearish
Timeframe : Weekly
Technical
Technical analysis of this Daily chart of USD/JPY indicates that the overall trend is slightly bearish. 57.14% of the signals given by moving averages are bearish. Caution: the strong bullish signals currently being given by short-term moving averages could quickly lead to a reversal of the trend. The Central Indicators market scanner is currently detecting a bullish signal that could impact this trend:
Bullish trend reversal : adaptative moving average 50
Type : Bullish
Timeframe : Daily
In fact, 12 technical indicators on 18 studied are currently positioned bullish. But beware of excesses. The Central Indicators scanner currently detects this:
Williams %R indicator is overbought : over -20
Type : Neutral
Timeframe : Daily
Pivot points : price is over resistance 1
Type : Neutral
Timeframe : Weekly
MACD crosses UP its Moving Average
Type : Bullish
Timeframe : Daily
Aroon indicator bullish trend
Type : Bullish
Timeframe : Daily
Price is back over the pivot point
Type : Bullish
Timeframe : Daily
Price is back under the pivot point
Type : Bearish
Timeframe : Weekly
An analysis of the price chart with the Central Patterns scanner (detector of chart patterns and resistances and supports) shows several results that can have an impact on the price change:
Near horizontal resistance
Type : Bearish
Timeframe : Daily
Resistance of channel is broken
Type : Bullish
Timeframe : Daily
The Central Candlesticks scanner which studies Japanese candlesticks did not detect anything.
| S3 | S2 | S1 | Price | R1 | R2 | R3 | |
|---|---|---|---|---|---|---|---|
| ProTrendLines | 87.29 | 103.11 | 104.73 | 105.50 | 106.23 | 107.98 | 109.56 |
| Change (%) | -17.26% | -2.27% | -0.73% | - | +0.69% | +2.35% | +3.85% |
| Change | -18.21 | -2.39 | -0.77 | - | +0.73 | +2.48 | +4.06 |
| Level | Minor | Major | Major | - | Intermediate | Minor | Major |
Pivot points can also be used to set your price objectives. Here is the price situation in relation to pivot points:
| Pivot points | S3 | S2 | S1 | PP | R1 | R2 | R3 |
|---|---|---|---|---|---|---|---|
| Standard | 104.22 | 104.52 | 104.89 | 105.19 | 105.56 | 105.86 | 106.23 |
| Camarilla | 105.08 | 105.14 | 105.20 | 105.26 | 105.32 | 105.38 | 105.44 |
| Woodie | 104.26 | 104.54 | 104.93 | 105.21 | 105.60 | 105.88 | 106.27 |
| Fibonacci | 104.52 | 104.78 | 104.93 | 105.19 | 105.45 | 105.60 | 105.86 |
| Pivot points | S3 | S2 | S1 | PP | R1 | R2 | R3 |
|---|---|---|---|---|---|---|---|
| Standard | 100.37 | 101.77 | 102.55 | 103.95 | 104.73 | 106.13 | 106.91 |
| Camarilla | 102.73 | 102.93 | 103.13 | 103.33 | 103.53 | 103.73 | 103.93 |
| Woodie | 100.06 | 101.62 | 102.24 | 103.80 | 104.42 | 105.98 | 106.60 |
| Fibonacci | 101.77 | 102.60 | 103.12 | 103.95 | 104.78 | 105.30 | 106.13 |
| Pivot points | S3 | S2 | S1 | PP | R1 | R2 | R3 |
|---|---|---|---|---|---|---|---|
| Standard | 101.65 | 102.83 | 103.74 | 104.92 | 105.83 | 107.01 | 107.92 |
| Camarilla | 104.07 | 104.26 | 104.45 | 104.64 | 104.83 | 105.02 | 105.22 |
| Woodie | 101.51 | 102.76 | 103.60 | 104.85 | 105.69 | 106.94 | 107.78 |
| Fibonacci | 102.83 | 103.63 | 104.13 | 104.92 | 105.72 | 106.22 | 107.01 |
Numerical data
The following are the details of the technical indicators and moving averages that were collected to generate this technical analysis:
| RSI (14): | 56.93 | |
| MACD (12,26,9): | -0.1500 | |
| Directional Movement: | 8.39 | |
| AROON (14): | 7.14 | |
| DEMA (21): | 104.57 | |
| Parabolic SAR (0,02-0,02-0,2): | 103.19 | |
| Elder Ray (13): | 0.54 | |
| Super Trend (3,10): | 103.01 | |
| Zig ZAG (10): | 105.48 | |
| VORTEX (21): | 0.9800 | |
| Stochastique (14,3,5): | 85.75 | |
| TEMA (21): | 104.62 | |
| Williams %R (14): | -6.05 | |
| Chande Momentum Oscillator (20): | 0.68 | |
| Repulse (5,40,3): | 1.1300 | |
| ROCnROLL: | 1 | |
| TRIX (15,9): | -0.0400 | |
| Courbe Coppock: | 0.73 |
| MA7: | 104.55 | |
| MA20: | 104.77 | |
| MA50: | 105.25 | |
| MA100: | 105.86 | |
| MAexp7: | 104.82 | |
| MAexp20: | 104.82 | |
| MAexp50: | 105.21 | |
| MAexp100: | 105.78 | |
| Price / MA7: | +0.91% | |
| Price / MA20: | +0.70% | |
| Price / MA50: | +0.24% | |
| Price / MA100: | -0.34% | |
| Price / MAexp7: | +0.64% | |
| Price / MAexp20: | +0.64% | |
| Price / MAexp50: | +0.27% | |
| Price / MAexp100: | -0.27% |
News
The latest news and videos published on USD/JPY at the time of the analysis were as follows:
-
 USD/JPY Technical Analysis for November 11, 2020 by FXEmpire
-
USD/JPY Technical Analysis for November 10, 2020 by FXEmpire
-
USD/JPY Technical Analysis for the Week of November 9, 2020 by FXEmpire
-
USD/JPY Technical Analysis for November 9, 2020 by FXEmpire
-
USD/JPY Technical Analysis for November 6, 2020 by FXEmpire
About author

Online


Add a comment
Comments
0 comments on the analysis USD/JPY - Daily