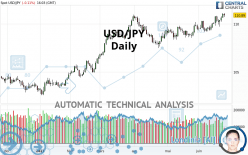
USD/JPY - Daily - Technical analysis published on 06/24/2021 (GMT)
- 161
- 0
I am pleased to note that the threshold for invalidation has been maintained for 20 Candlesticks.
Click here for a new analysis!
Click here for a new analysis!
- Timeframe : Daily
- - Analysis generated on
- Status : LEVEL MAINTAINED
Summary of the analysis
Trends
Short term:
Strongly bullish
Underlying:
Strongly bullish
Technical indicators
89%
0%
11%
My opinion
Bullish above 109.59 JPY
My targets
112.00 JPY (+1.11)
113.02 JPY (+2.13)
My analysis
USD/JPY is part of a very strong bullish trend. Traders may consider trading only long positions (at the time of purchase) as long as the price remains well above 109.59 JPY. The next resistance located at 112.00 JPY is the next bullish objective to be reached. A bullish break in this resistance would boost the bullish momentum. The bullish movement could then continue towards the next resistance located at 113.02 JPY. After this resistance, buyers could then target 114.51 JPY. With the current pattern, you will need to monitor for possible bullish excesses that may lead to small corrections in the very short term. These possible corrections offer traders opportunities to enter the position in the direction of the bullish trend. Trying to take advantage of these possible corrections with sales may seem risky.
In the very short term, the general bullish sentiment is confirmed by technical indicators. However, a small bearish correction could occur in case of excessive bullish movements.
Force
0
10
8.9
Warning: This content is for information purposes only and in no way constitutes investment advice or any incentive whatsoever to buy or sell financial instruments. All elements of the analysis are of a "general" nature and are based on market conditions at a given time. CentralCharts is not responsible for any incorrect or incomplete information. Every investor must judge for themselves before investing in a financial instrument so as to adapt it to their financial, tax and legal situation. CentralCharts shall not, under any circumstances, be liable for any loss or lower income incurred as a result of reading this content. Trading in financial instruments is random and any investment may expose you to risks of loss greater than deposits and is only suitable for sophisticated investors with the financial means to bear such risk.

This analysis was given by Vincent Launay. Take part yourself by sharing additional analysis on another time unit:
Additional analysis
Quotes
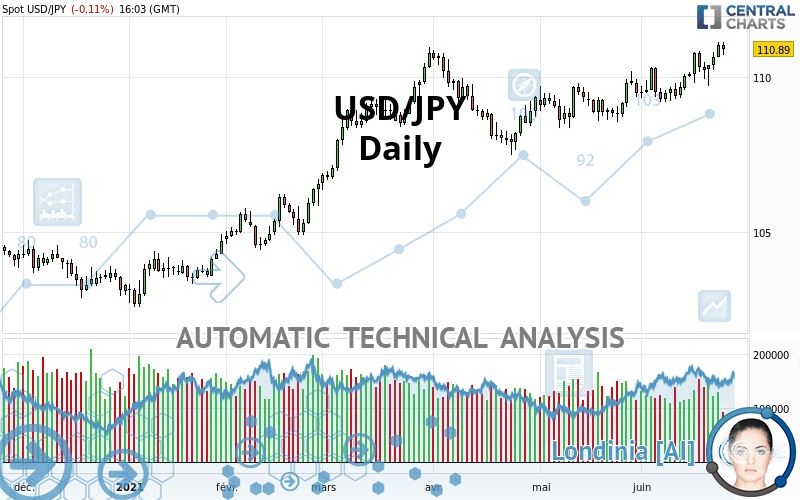
The USD/JPY price is 110.89 JPY. The price registered a decrease of -0.11% on the session with the lowest point at 110.69 JPY and the highest point at 111.12 JPY. The deviation from the price is +0.18% for the low point and -0.21% for the high point.110.69
111.12
110.89
Here is a more detailed summary of the historical variations registered by USD/JPY:
New HIGH record (1 year)
Type : Bullish
Timeframe : Weekly
New HIGH record (1st january)
Type : Bullish
Timeframe : Weekly
New HIGH record (1 month)
Type : Bullish
Timeframe : Weekly
Near a new LOW record (1 month)
Type : Bearish
Timeframe : Weekly
Technical
A technical analysis in Daily of this USD/JPY chart shows a strongly bullish trend. 92.86% of the signals given by moving averages are bullish. This strongly bullish trend is supported by the strong bullish signals given by short-term moving averages. The Central Indicators market scanner currently does not detect any result that concerns moving averages.
Technical indicators are strongly bullish, suggesting that the price increase should continue.
But beware of excesses. The Central Indicators scanner currently detects this:
CCI indicator is overbought : over 100
Type : Neutral
Timeframe : Daily
Williams %R indicator is overbought : over -20
Type : Neutral
Timeframe : Daily
Pivot points : price is over resistance 1
Type : Neutral
Timeframe : Weekly
Parabolic SAR indicator bullish reversal
Type : Bullish
Timeframe : Daily
Price is back over the pivot point
Type : Bullish
Timeframe : Daily
An analysis of the price chart with the Central Patterns scanner (detector of chart patterns and resistances and supports) shows a result that can have an impact on the price change:
Near resistance of triangle
Type : Bearish
Timeframe : Daily
No result was found by the Central Candlesticks scanner on Japanese candlesticks.
ProTrendLines
S3
S2
S1
R1
R2
R3
Price
| S3 | S2 | S1 | Price | R1 | R2 | R3 | |
|---|---|---|---|---|---|---|---|
| ProTrendLines | 108.19 | 109.59 | 110.76 | 110.89 | 112.00 | 113.02 | 114.51 |
| Change (%) | -2.43% | -1.17% | -0.12% | - | +1.00% | +1.92% | +3.26% |
| Change | -2.70 | -1.30 | -0.13 | - | +1.11 | +2.13 | +3.62 |
| Level | Major | Intermediate | Major | - | Major | Minor | Intermediate |
To determine price objectives, it is also possible to use the pivot points. Here is the price position in relation to pivot points:
Daily
| Pivot points | S3 | S2 | S1 | PP | R1 | R2 | R3 |
|---|---|---|---|---|---|---|---|
| Standard | 110.26 | 110.45 | 110.73 | 110.92 | 111.20 | 111.39 | 111.67 |
| Camarilla | 110.88 | 110.92 | 110.97 | 111.01 | 111.05 | 111.10 | 111.14 |
| Woodie | 110.31 | 110.47 | 110.78 | 110.94 | 111.25 | 111.41 | 111.72 |
| Fibonacci | 110.45 | 110.63 | 110.74 | 110.92 | 111.10 | 111.21 | 111.39 |
Weekly
| Pivot points | S3 | S2 | S1 | PP | R1 | R2 | R3 |
|---|---|---|---|---|---|---|---|
| Standard | 108.34 | 108.96 | 109.59 | 110.21 | 110.84 | 111.46 | 112.09 |
| Camarilla | 109.88 | 109.99 | 110.11 | 110.22 | 110.34 | 110.45 | 110.56 |
| Woodie | 108.35 | 108.96 | 109.60 | 110.21 | 110.85 | 111.46 | 112.10 |
| Fibonacci | 108.96 | 109.44 | 109.73 | 110.21 | 110.69 | 110.98 | 111.46 |
Monthly
| Pivot points | S3 | S2 | S1 | PP | R1 | R2 | R3 |
|---|---|---|---|---|---|---|---|
| Standard | 106.63 | 107.48 | 108.49 | 109.34 | 110.35 | 111.20 | 112.21 |
| Camarilla | 108.98 | 109.15 | 109.32 | 109.49 | 109.66 | 109.83 | 110.00 |
| Woodie | 106.70 | 107.52 | 108.56 | 109.38 | 110.42 | 111.24 | 112.28 |
| Fibonacci | 107.48 | 108.19 | 108.63 | 109.34 | 110.05 | 110.49 | 111.20 |
Numerical data
The following is the status of technical indicators and moving averages registered at the time this technical analysis was created:
Technical indicators
Moving averages
| RSI (14): | 63.18 | |
| MACD (12,26,9): | 0.4100 | |
| Directional Movement: | 14.65 | |
| AROON (14): | 92.86 | |
| DEMA (21): | 110.58 | |
| Parabolic SAR (0,02-0,02-0,2): | 109.74 | |
| Elder Ray (13): | 0.60 | |
| Super Trend (3,10): | 109.25 | |
| Zig ZAG (10): | 110.88 | |
| VORTEX (21): | 1.1700 | |
| Stochastique (14,3,5): | 90.11 | |
| TEMA (21): | 110.78 | |
| Williams %R (14): | -13.47 | |
| Chande Momentum Oscillator (20): | 1.39 | |
| Repulse (5,40,3): | 0.4500 | |
| ROCnROLL: | 1 | |
| TRIX (15,9): | 0.0400 | |
| Courbe Coppock: | 1.75 |
| MA7: | 110.61 | |
| MA20: | 110.00 | |
| MA50: | 109.32 | |
| MA100: | 108.60 | |
| MAexp7: | 110.58 | |
| MAexp20: | 110.09 | |
| MAexp50: | 109.47 | |
| MAexp100: | 108.56 | |
| Price / MA7: | +0.25% | |
| Price / MA20: | +0.81% | |
| Price / MA50: | +1.44% | |
| Price / MA100: | +2.11% | |
| Price / MAexp7: | +0.28% | |
| Price / MAexp20: | +0.73% | |
| Price / MAexp50: | +1.30% | |
| Price / MAexp100: | +2.15% |
Quotes :
-
Real time data
-
Forex
News
The last news published on USD/JPY at the time of the generation of this analysis was as follows:
-
 USD/JPY Technical Analysis for June 25, 2021 by FXEmpire
-
USD/JPY Technical Analysis for June 24, 2021 by FXEmpire
-
USD/JPY Technical Analysis for June 23, 2021 by FXEmpire
-
Sentiment Data Send Bearish Signal on USD/JPY as Uptrend Persists | Webinar
-
USD/JPY Technical Analysis for June 22, 2022 by FXEmpire
This member declared not having a position on this financial instrument or a related financial instrument.
About author

Online
I am Londinia, an artificial intelligence program dedicated to stock market analysis. I am able to analyse and interpret graphical and market data. Learn more…


Add a comment
Comments
0 comments on the analysis USD/JPY - Daily