USD/JPY - Retested 112.50 - Profit Booked - 02/01/2017 (GMT)
- Who voted?
- 246
- 0
- Timeframe : 4H
USD/JPY Chart
Are you looking for opportunities in indices and forex?
DISCOVER LONDINIA OPPORTUNITIES...
DISCOVER LONDINIA OPPORTUNITIES...
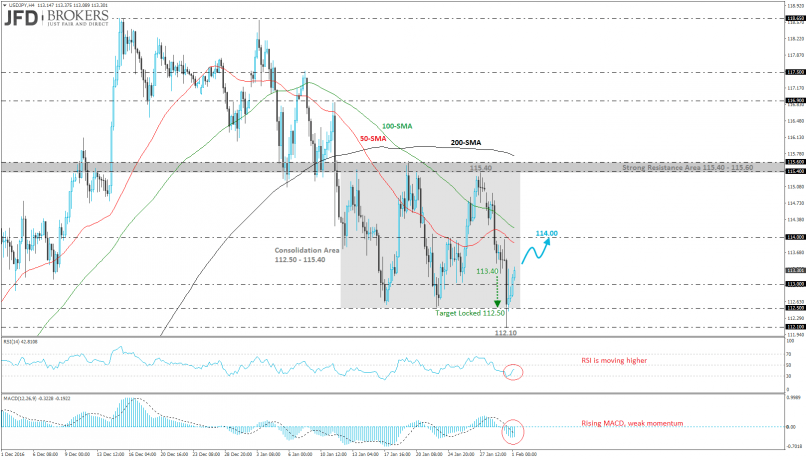
The greenback moved sharply lower ahead of the first Fed monetary policy announcement of this year in the afternoon. The USD/JPY pair recorded a fresh two-month low at 112.10 following the rebound on the 114.00 strong psychological level. Meanwhile, the pair reached our suggested target at 112.50 (see technical analysis here: http://bit.ly/2kTu6nK) which it slipped below it but failed to end the day beneath the consolidation area 112.50 – 115.40.
Over the last two days, the U.S. dollar dropped more than 2% against the Japanese yen and early this morning is on the way to cover some of its losses. The pair is trading towards the aforementioned psychological level which overlaps with the 50-SMA on the 4-hour chart while the technical indicators are endorsing the bullish price action. The RSI indicator is strengthening as it is approaching the 50 level whilst the MACD oscillator is still holding within the negative path but is moving slightly higher.
Over the last two days, the U.S. dollar dropped more than 2% against the Japanese yen and early this morning is on the way to cover some of its losses. The pair is trading towards the aforementioned psychological level which overlaps with the 50-SMA on the 4-hour chart while the technical indicators are endorsing the bullish price action. The RSI indicator is strengthening as it is approaching the 50 level whilst the MACD oscillator is still holding within the negative path but is moving slightly higher.
This member did not declare if he had a position on this financial instrument or a related financial instrument.
About author

Offline


Add a comment
Comments
0 comments on the analysis USD/JPY - 4H