USD/JPY - Plunged Again Near 112.50 Level - 02/02/2017 (GMT)
- Who voted?
- 385
- 0
- Timeframe : 4H

USD/JPY Chart
Are you looking for opportunities in indices and forex?
DISCOVER LONDINIA OPPORTUNITIES...
DISCOVER LONDINIA OPPORTUNITIES...
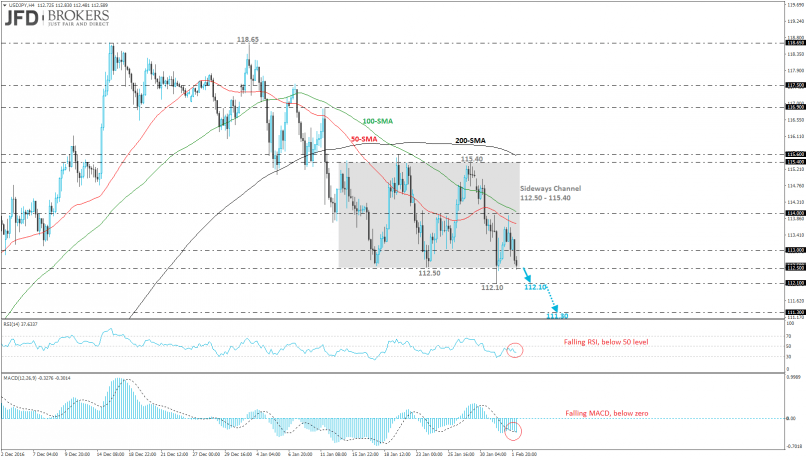
Yesterday’s Fed meeting didn’t have a severe impact on the U.S. dollar as they left the interest rate unchanged and didn't mention something new for the economy. The USD/JPY pair had a positive day while it capped below the 114.00 strong psychological level, few pips below our suggested target in the previous analysis (see technical analysis here: http://bit.ly/2jTXomh). Also, the price managed to challenge the 50-SMA on the 4-hour chart and slipped lower at 112.50.
Technically, the pair is still developing within a sideways channel with upper band the 115.40 resistance level and lower band the 112.50 support barrier. Our expectation is a further decline in price, if there is a penetration of the latter level until the 112.10 obstacle or moreover until 111.30. Technical indicators are biased lower after the east move while the MACD oscillator is trying to cross its trigger line to the upside in the negative territory. The RSI indicator is sloping to the downside and is moving towards the 30 level.
Technically, the pair is still developing within a sideways channel with upper band the 115.40 resistance level and lower band the 112.50 support barrier. Our expectation is a further decline in price, if there is a penetration of the latter level until the 112.10 obstacle or moreover until 111.30. Technical indicators are biased lower after the east move while the MACD oscillator is trying to cross its trigger line to the upside in the negative territory. The RSI indicator is sloping to the downside and is moving towards the 30 level.
This member did not declare if he had a position on this financial instrument or a related financial instrument.
About author

Offline


Add a comment
Comments
0 comments on the analysis USD/JPY - 4H