USD/JPY - Slipped and Reached Our Target! - 02/17/2017 (GMT)
- Who voted?
- 255
- 0
- Timeframe : 4H
USD/JPY Chart
Are you looking for opportunities in indices and forex?
DISCOVER LONDINIA OPPORTUNITIES...
DISCOVER LONDINIA OPPORTUNITIES...
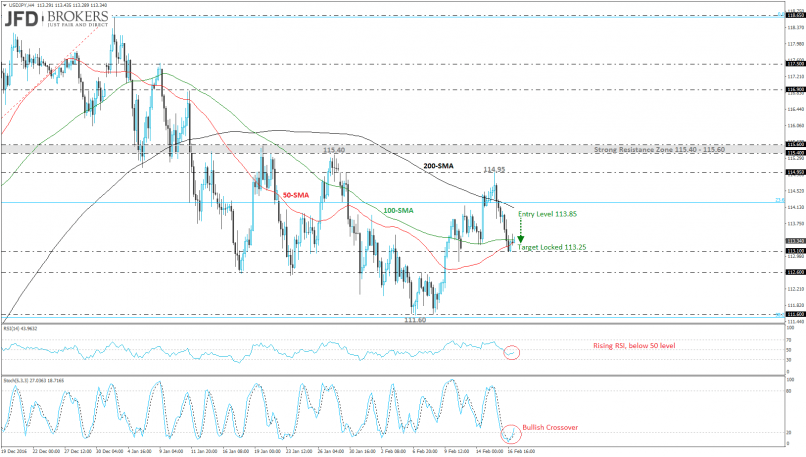
The U.S. dollar continued to plunge against the Japanese yen for the second consecutive day despite another round of better than expected U.S. data. The USD/JPY pair fell 0.9% over the last two days and reached our recommended target at 113.25 support barrier (see technical analysis here: http://bit.ly/2loEkQZ). Moreover, the pair slipped lower and hit the 113.10 price level which seems to be a good retracement level.
The technical structure suggests upward momentum for the next sessions as the 50 and 100 SMAs on the 4-hour chart are ready to create a bullish crossover which indicates a rising on price. The RSI indicator fell below the 50 level but now is sloping higher to enter again the positive path. The stochastic oscillator is moving to the upside after the rebound in the oversold area endorsing our bullish thought. The next level to watch is the 23.6% Fibonacci retracement level, of the last upward movement, (low 27th of September, 2016 and high 3rd of January, 2016) near 114.20. On the other side, if the price has a downward run below the 113.10, it would be exposed until the 112.60 or further to 111.60.
The technical structure suggests upward momentum for the next sessions as the 50 and 100 SMAs on the 4-hour chart are ready to create a bullish crossover which indicates a rising on price. The RSI indicator fell below the 50 level but now is sloping higher to enter again the positive path. The stochastic oscillator is moving to the upside after the rebound in the oversold area endorsing our bullish thought. The next level to watch is the 23.6% Fibonacci retracement level, of the last upward movement, (low 27th of September, 2016 and high 3rd of January, 2016) near 114.20. On the other side, if the price has a downward run below the 113.10, it would be exposed until the 112.60 or further to 111.60.
This member did not declare if he had a position on this financial instrument or a related financial instrument.
About author

Offline


Add a comment
Comments
0 comments on the analysis USD/JPY - 4H