USD/JPY - Met its Falling Trend Line near $113.00 - 05/08/2017 (GMT)
- Who voted?
- 507
- 0
- Timeframe : Daily

USD/JPY Chart
Are you looking for opportunities in indices and forex?
DISCOVER LONDINIA OPPORTUNITIES...
DISCOVER LONDINIA OPPORTUNITIES...
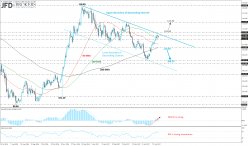
Over the last days, USD/JPY is trying without success to surpass the resistance level at 112.90, near the falling trendline, despite the better than expected U.S. employment report. The 50-SMA shows that is heading to cross below the 200-SMA indicating the continuation of the downtrend. If the bears manage to pull the price below 110.60, our target will be 108.15.
Otherwise, a successful penetration of the decreasing trend line and the 113.50 strong resistance level will send the pair towards 115.50 key level. MACD is rising above zero, as well as RSI which is near 70 level, however, RSI showed some decrease of momentum.
Otherwise, a successful penetration of the decreasing trend line and the 113.50 strong resistance level will send the pair towards 115.50 key level. MACD is rising above zero, as well as RSI which is near 70 level, however, RSI showed some decrease of momentum.
This member did not declare if he had a position on this financial instrument or a related financial instrument.
About author

Offline


Add a comment
Comments
0 comments on the analysis USD/JPY - Daily