USD/JPY - Failed to Surprice - Struggled Below the 112.20 Key Level - 05/25/2017 (GMT)
- Who voted?
- 362
- 0
- Timeframe : Daily
USD/JPY Chart
Are you looking for opportunities in indices and forex?
DISCOVER LONDINIA OPPORTUNITIES...
DISCOVER LONDINIA OPPORTUNITIES...
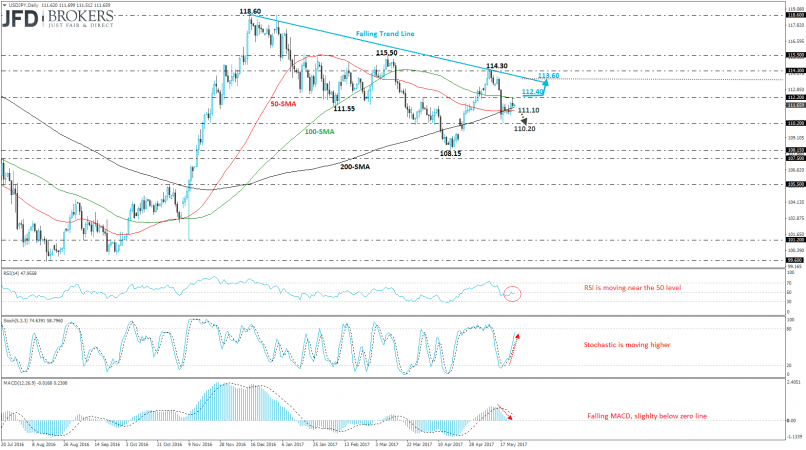
The Federal Reserve minutes failed to surprise and drove the U.S. dollar lower during yesterday’s session. The USD/JPY pair found a strong resistance obstacle on the 100-daily SMA which overlaps with the 112.20 barrier and rebounded on it while it completed a negative daily session. Over the last trading periods, the price lost its strong momentum and is developing near the three simple moving averages (50, 100 and 200) SMAs. We could experience a run above the 112.20 handle that will push the pair further up at the descending falling trend line near 113.60. On the other hand, a slip below the three SMAs will hit the 110.20 support level.
Technical indicators on the daily chart are biased slightly lower, however, the stochastic oscillator is moving to the upside. The MACD oscillator is moving below the trigger line while it hit the neutral area suggesting a weaker price action in the next few periods. In addition, the Relative Strength Index (RSI) is following a downward path below 50 and is flattening, confirming the recent neutral attitude of the price.
Technical indicators on the daily chart are biased slightly lower, however, the stochastic oscillator is moving to the upside. The MACD oscillator is moving below the trigger line while it hit the neutral area suggesting a weaker price action in the next few periods. In addition, the Relative Strength Index (RSI) is following a downward path below 50 and is flattening, confirming the recent neutral attitude of the price.
This member did not declare if he had a position on this financial instrument or a related financial instrument.
About author

Offline


Add a comment
Comments
0 comments on the analysis USD/JPY - Daily