USD/JPY - USD/JPY Continues to Show Bullish Signals - 06/30/2017 (GMT)
- Who voted?
- 585
- 0
- Timeframe : Daily
USD/JPY Chart
Are you looking for opportunities in indices and forex?
DISCOVER LONDINIA OPPORTUNITIES...
DISCOVER LONDINIA OPPORTUNITIES...
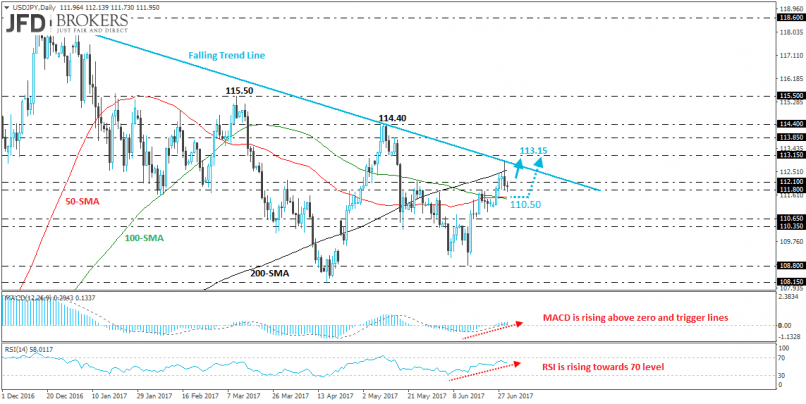
The USD/JPY had the biggest losses of the week on Thursday and is in the process to reverse its weekly performance to negative. The pair tried to surpass above the area between 111.80 and 112.10 but it touched the falling trendline with a spike and slipped again below the mentioned upper boundary of the area. It continues to develop below the 200-SMA on the daily chart and above both the 50 and 100 SMAs. We would expect the pair to try again to test the descending trend line which is holding since December 2016. Alternatively, if the pair slips below the 111.80, we would expect it to find support near the two moving averages around 111.50 before it will rise again towards 113.15.
Technical indicators on the daily chart are strongly indicating a further bullish move. The MACD oscillator is moving above both its zero and trigger lines, suggesting a stronger price action in the next few periods, while the Relative Strength Index (RSI) is following an upward path above 50, even though it faces some short-term momentum slow down.
Technical indicators on the daily chart are strongly indicating a further bullish move. The MACD oscillator is moving above both its zero and trigger lines, suggesting a stronger price action in the next few periods, while the Relative Strength Index (RSI) is following an upward path above 50, even though it faces some short-term momentum slow down.
This member did not declare if he had a position on this financial instrument or a related financial instrument.
About author

Offline


Add a comment
Comments
0 comments on the analysis USD/JPY - Daily