USD/JPY - Rebouded on 114.40 and Hit Significant Obstacle at 112.95 - 11/15/2017 (GMT)
- Who voted?
- 454
- 0
- Timeframe : Daily
USD/JPY Chart
Are you looking for opportunities in indices and forex?
DISCOVER LONDINIA OPPORTUNITIES...
DISCOVER LONDINIA OPPORTUNITIES...
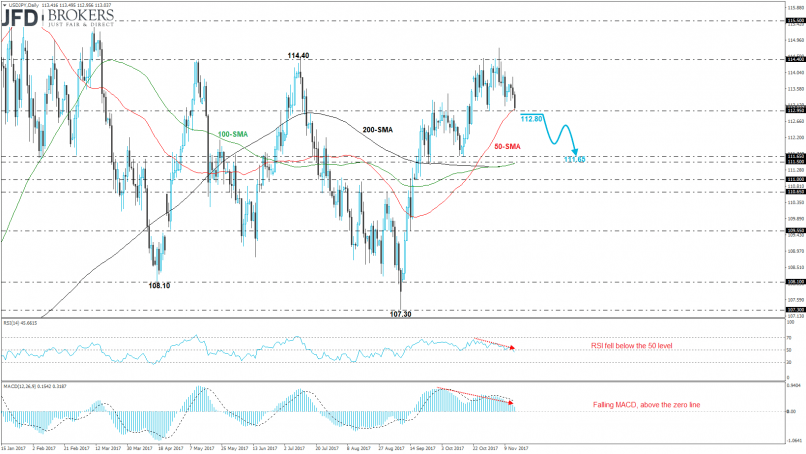
The USD/JPY pair is developing within a trading range over the last eight months with upper boundary the 114.40 resistance level and lower boundary the 108.10 support level. During September, the U.S. dollar had a bearish day below the lower band versus the Japanese yen but failed to drive the price lower and returned back to the channel. Also, the price hit several times the upper level with unsuccessful attempts for further upside movement.
Yesterday, the price printed the third consecutive bearish day and hit the 50-day SMA, which coincides with the 112.95 support level. If the price slips below it will open the way for the 111.50 – 111.65 support zone. The RSI indicator is falling and slipped below its mid-level and the MACD oscillator is moving lower in the positive path.
Yesterday, the price printed the third consecutive bearish day and hit the 50-day SMA, which coincides with the 112.95 support level. If the price slips below it will open the way for the 111.50 – 111.65 support zone. The RSI indicator is falling and slipped below its mid-level and the MACD oscillator is moving lower in the positive path.
This member declared not having a position on this financial instrument or a related financial instrument.
About author

Offline


Add a comment
Comments
0 comments on the analysis USD/JPY - Daily