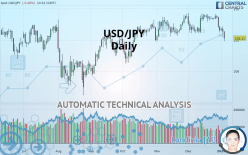
USD/JPY - Daily - Technical analysis published on 01/03/2020 (GMT)
- Who voted?
- 271
- 0
Click here for a new analysis!
- Timeframe : Daily
- - Analysis generated on
- Status : INVALID

Summary of the analysis

Additional analysis
Quotes
The USD/JPY rating is 108.11 JPY. The price is lower by -0.40% since the last closing and was between 107.91 JPY and 108.56 JPY. This implies that the price is at +0.19% from its lowest and at -0.41% from its highest.Here is a more detailed summary of the historical variations registered by USD/JPY:
Near a new HIGH record (1st january)
Type : Bullish
Timeframe : Weekly
Near a new HIGH record (1 month)
Type : Bullish
Timeframe : Weekly
Technical
A technical analysis in Daily of this USD/JPY chart shows a slightly bearish trend. 60.71% of the signals given by moving averages are bearish. The overall trend could accelerate as a result of the strong bearish signals from short-term moving averages. An assessment of moving averages reveals several bearish signals that could impact this trend:
Bearish trend reversal : Moving Average 50
Type : Bearish
Timeframe : Daily
Bearish trend reversal : adaptative moving average 100
Type : Bearish
Timeframe : Daily
Bearish price crossover with adaptative moving average 50
Type : Bearish
Timeframe : Daily
Technical indicators are strongly bearish, suggesting that the price decline is expected to continue.
But beware of excesses. The Central Indicators scanner currently detects this:
CCI indicator is oversold : under -100
Type : Neutral
Timeframe : Daily
Pivot points : price is under support 1
Type : Neutral
Timeframe : Daily
Pivot points : price is under support 3
Type : Neutral
Timeframe : Weekly
Aroon indicator bearish trend
Type : Bearish
Timeframe : Daily
MACD indicator is back under 0
Type : Bearish
Timeframe : Daily
An analysis of the price chart with the Central Patterns scanner (detector of chart patterns and resistances and supports) shows several results that can have an impact on the price change:
Near horizontal support
Type : Bullish
Timeframe : Daily
Support of channel is broken
Type : Bearish
Timeframe : Daily
No result was found by the Central Candlesticks scanner on Japanese candlesticks.
| S3 | S2 | S1 | Price | R1 | R2 | R3 | |
|---|---|---|---|---|---|---|---|
| ProTrendLines | 105.39 | 106.60 | 107.17 | 108.11 | 108.49 | 109.94 | 110.57 |
| Change (%) | -2.52% | -1.40% | -0.87% | - | +0.35% | +1.69% | +2.28% |
| Change | -2.72 | -1.51 | -0.94 | - | +0.38 | +1.83 | +2.46 |
| Level | Minor | Minor | Minor | - | Major | Intermediate | Minor |
Pivot points can also be used to set your price objectives. Here is the price situation in relation to pivot points:
| Pivot points | S3 | S2 | S1 | PP | R1 | R2 | R3 |
|---|---|---|---|---|---|---|---|
| Standard | 107.55 | 107.88 | 108.21 | 108.54 | 108.87 | 109.20 | 109.53 |
| Camarilla | 108.36 | 108.42 | 108.48 | 108.54 | 108.60 | 108.66 | 108.72 |
| Woodie | 107.55 | 107.88 | 108.21 | 108.54 | 108.87 | 109.20 | 109.53 |
| Fibonacci | 107.88 | 108.13 | 108.29 | 108.54 | 108.79 | 108.95 | 109.20 |
| Pivot points | S3 | S2 | S1 | PP | R1 | R2 | R3 |
|---|---|---|---|---|---|---|---|
| Standard | 108.93 | 109.12 | 109.29 | 109.48 | 109.65 | 109.84 | 110.01 |
| Camarilla | 109.35 | 109.38 | 109.42 | 109.45 | 109.48 | 109.52 | 109.55 |
| Woodie | 108.91 | 109.12 | 109.27 | 109.48 | 109.63 | 109.84 | 109.99 |
| Fibonacci | 109.12 | 109.26 | 109.35 | 109.48 | 109.62 | 109.71 | 109.84 |
| Pivot points | S3 | S2 | S1 | PP | R1 | R2 | R3 |
|---|---|---|---|---|---|---|---|
| Standard | 106.82 | 107.62 | 108.12 | 108.92 | 109.42 | 110.22 | 110.72 |
| Camarilla | 108.25 | 108.37 | 108.49 | 108.61 | 108.73 | 108.85 | 108.97 |
| Woodie | 106.66 | 107.55 | 107.96 | 108.85 | 109.26 | 110.15 | 110.56 |
| Fibonacci | 107.62 | 108.12 | 108.43 | 108.92 | 109.42 | 109.73 | 110.22 |
Numerical data
The following is the status of the technical indicators and moving averages at the time of publication of this technical analysis:
| RSI (14): | 33.93 | |
| MACD (12,26,9): | -0.0900 | |
| Directional Movement: | -18.71 | |
| AROON (14): | -42.86 | |
| DEMA (21): | 108.93 | |
| Parabolic SAR (0,02-0,02-0,2): | 109.60 | |
| Elder Ray (13): | -0.68 | |
| Super Trend (3,10): | 109.47 | |
| Zig ZAG (10): | 108.15 | |
| VORTEX (21): | 0.9100 | |
| Stochastique (14,3,5): | 18.72 | |
| TEMA (21): | 108.70 | |
| Williams %R (14): | -87.01 | |
| Chande Momentum Oscillator (20): | -1.41 | |
| Repulse (5,40,3): | -0.6000 | |
| ROCnROLL: | 2 | |
| TRIX (15,9): | 0.0100 | |
| Courbe Coppock: | 0.72 |
| MA7: | 108.84 | |
| MA20: | 109.11 | |
| MA50: | 108.95 | |
| MA100: | 108.20 | |
| MAexp7: | 108.70 | |
| MAexp20: | 108.97 | |
| MAexp50: | 108.84 | |
| MAexp100: | 108.60 | |
| Price / MA7: | -0.67% | |
| Price / MA20: | -0.92% | |
| Price / MA50: | -0.77% | |
| Price / MA100: | -0.08% | |
| Price / MAexp7: | -0.54% | |
| Price / MAexp20: | -0.79% | |
| Price / MAexp50: | -0.67% | |
| Price / MAexp100: | -0.45% |
News
Don"t forget to follow the news on USD/JPY. At the time of publication of this analysis, the latest news was as follows:
-
 USD/JPY Technical Analysis for January 03, 2020 by FXEmpire
-
USD/JPY Technical Analysis for January 02, 2019 by FXEmpire
-
USD/JPY Technical Analysis for December 31, 2019 by FXEmpire
-
USD/JPY Technical Analysis for December 30, 2019 by FXEmpire
-
USD/JPY Technical Analysis for the week of December 30, 2019 by FXEmpire
About author

Online


Add a comment
Comments
0 comments on the analysis USD/JPY - Daily