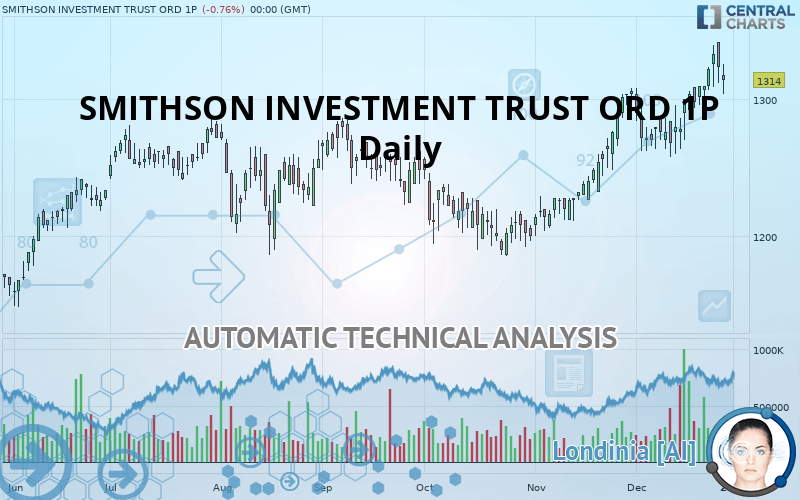
SMITHSON INVESTMENT TRUST ORD 1P - Daily - Technical analysis published on 12/31/2019 (GMT)
- Who voted?
- 318
- 0
Click here for a new analysis!
- Timeframe : Daily
- - Analysis generated on
- Status : TARGET REACHED

Summary of the analysis

Additional analysis
Quotes
The SMITHSON INVESTMENT TRUST ORD 1P rating is 1,314 GBX. The price is lower by -0.76% since the last closing and was traded between 1,305 GBX and 1,326 GBX over the period. The price is currently at +0.73% from its lowest and -0.90% from its highest.The Central Gaps scanner detects the formation of a bullish gap marking the strong presence of buyers against sellers at the opening. This formed a quotation gap.
Opening Gap UP
Type : Bullish
Timeframe : Openning
A study of price movements over other periods shows the following variations:
New HIGH record (1 year)
Type : Bullish
Timeframe : Weekly
New HIGH record (1st january)
Type : Bullish
Timeframe : Weekly
New HIGH record (1 month)
Type : Bullish
Timeframe : Weekly
Near a new LOW record (1 month)
Type : Bearish
Timeframe : Weekly
Technical
A technical analysis in Daily of this SMITHSON INVESTMENT TRUST ORD 1P chart shows a strongly bullish trend. The signals given by the moving averages are 92.86% bullish. This strong bullish trend is confirmed by the strong signals currently being given by short-term moving averages. The Central Indicators market scanner currently does not detect any result that concerns moving averages.
In fact, 11 technical indicators on 18 studied are currently positioned bullish. But beware of excesses. The Central Indicators scanner currently detects this:
RSI indicator is overbought : over 70
Type : Neutral
Timeframe : Daily
CCI indicator is overbought : over 100
Type : Neutral
Timeframe : Daily
Williams %R indicator is overbought : over -20
Type : Neutral
Timeframe : Daily
Pivot points : price is over resistance 1
Type : Neutral
Timeframe : Weekly
Price is back over the pivot point
Type : Bullish
Timeframe : Daily
An analysis of the price chart with the Central Patterns scanner (detector of chart patterns and resistances and supports) shows a result that can have an impact on the price change:
Near resistance of channel
Type : Bearish
Timeframe : Daily
The Central Candlesticks scanner which studies Japanese candlesticks did not detect anything.
| S3 | S2 | S1 | Price | |
|---|---|---|---|---|
| ProTrendLines | 1,208 | 1,251 | 1,279 | 1,314 |
| Change (%) | -8.07% | -4.79% | -2.66% | - |
| Change | -106 | -63 | -35 | - |
| Level | Minor | Minor | Major | - |
Pivot points can also be used to set your price objectives. Here is the price situation in relation to pivot points:
| Pivot points | S3 | S2 | S1 | PP | R1 | R2 | R3 |
|---|---|---|---|---|---|---|---|
| Standard | 1,283 | 1,296 | 1,315 | 1,327 | 1,346 | 1,359 | 1,377 |
| Camarilla | 1,324 | 1,327 | 1,330 | 1,333 | 1,336 | 1,339 | 1,342 |
| Woodie | 1,286 | 1,297 | 1,317 | 1,329 | 1,349 | 1,360 | 1,380 |
| Fibonacci | 1,296 | 1,308 | 1,315 | 1,327 | 1,339 | 1,347 | 1,359 |
| Pivot points | S3 | S2 | S1 | PP | R1 | R2 | R3 |
|---|---|---|---|---|---|---|---|
| Standard | 1,243 | 1,257 | 1,283 | 1,297 | 1,323 | 1,337 | 1,363 |
| Camarilla | 1,299 | 1,303 | 1,306 | 1,310 | 1,314 | 1,317 | 1,321 |
| Woodie | 1,250 | 1,260 | 1,290 | 1,300 | 1,330 | 1,340 | 1,370 |
| Fibonacci | 1,257 | 1,272 | 1,281 | 1,297 | 1,312 | 1,321 | 1,337 |
| Pivot points | S3 | S2 | S1 | PP | R1 | R2 | R3 |
|---|---|---|---|---|---|---|---|
| Standard | 1,125 | 1,163 | 1,233 | 1,271 | 1,341 | 1,379 | 1,449 |
| Camarilla | 1,274 | 1,284 | 1,294 | 1,304 | 1,314 | 1,324 | 1,334 |
| Woodie | 1,142 | 1,171 | 1,250 | 1,279 | 1,358 | 1,387 | 1,466 |
| Fibonacci | 1,163 | 1,204 | 1,229 | 1,271 | 1,312 | 1,337 | 1,379 |
Numerical data
The following is the status of technical indicators and moving averages registered at the time this technical analysis was created:
| RSI (14): | 68.00 | |
| MACD (12,26,9): | 18.0000 | |
| Directional Movement: | 18 | |
| AROON (14): | 71 | |
| DEMA (21): | 1,318 | |
| Parabolic SAR (0,02-0,02-0,2): | 1,284 | |
| Elder Ray (13): | 23 | |
| Super Trend (3,10): | 1,263 | |
| Zig ZAG (10): | 1,324 | |
| VORTEX (21): | 1.0000 | |
| Stochastique (14,3,5): | 89.00 | |
| TEMA (21): | 1,324 | |
| Williams %R (14): | -21.00 | |
| Chande Momentum Oscillator (20): | 48 | |
| Repulse (5,40,3): | 1.0000 | |
| ROCnROLL: | 1 | |
| TRIX (15,9): | 0.0000 | |
| Courbe Coppock: | 5.00 |
| MA7: | 1,314 | |
| MA20: | 1,293 | |
| MA50: | 1,254 | |
| MA100: | 1,248 | |
| MAexp7: | 1,315 | |
| MAexp20: | 1,295 | |
| MAexp50: | 1,270 | |
| MAexp100: | 1,250 | |
| Price / MA7: | -0% | |
| Price / MA20: | +1.62% | |
| Price / MA50: | +4.78% | |
| Price / MA100: | +5.29% | |
| Price / MAexp7: | -0.08% | |
| Price / MAexp20: | +1.47% | |
| Price / MAexp50: | +3.46% | |
| Price / MAexp100: | +5.12% |
About author

Online


Add a comment
Comments
0 comments on the analysis SMITHSON INVESTMENT TRUST ORD 1P - Daily