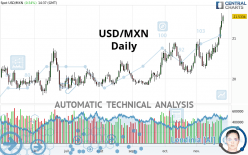
USD/MXN - Daily - Technical analysis published on 11/25/2021 (GMT)
- 210
- 0
Click here for a new analysis!
- Timeframe : Daily
- - Analysis generated on
- Status : TARGET REACHED

Summary of the analysis

Additional analysis
Quotes
The USD/MXN price is 21.5334 MXN. The price has increased by +0.54% since the last closing with the lowest point at 21.3600 MXN and the highest point at 21.5734 MXN. The deviation from the price is +0.81% for the low point and -0.19% for the high point.A bearish opening was detected by the Central Gaps scanner. Sellers are trying to impose a bearish trend in the very short term.
Bearish opening
Type : Bearish
Timeframe : Openning
A study of price movements over other periods shows the following variations:
Near a new HIGH record (1st january)
Type : Bullish
Timeframe : Weekly
Near a new HIGH record (1 month)
Type : Bullish
Timeframe : Weekly
Technical
Technical analysis of USD/MXN in Daily shows a strongly overall bullish trend. 92.86% of the signals given by moving averages are bullish. This strongly bullish trend is supported by the strong bullish signals given by short-term moving averages. There is no crossing of moving average by the price or crossing of moving averages between themselves.
In fact, according to the parameters integrated into the Central Analyzer system, 17 technical indicators out of 18 analysed are currently bullish. Caution: the Central Indicators scanner currently detects an excess:
RSI indicator is overbought : over 70
Type : Neutral
Timeframe : Daily
CCI indicator is overbought : over 100
Type : Neutral
Timeframe : Daily
Previous candle closed over Bollinger bands
Type : Neutral
Timeframe : Daily
Williams %R indicator is overbought : over -20
Type : Neutral
Timeframe : Daily
Pivot points : price is over resistance 3
Type : Neutral
Timeframe : Weekly
Price is back over the pivot point
Type : Bullish
Timeframe : Daily
An analysis of the price chart with the Central Patterns scanner (detector of chart patterns and resistances and supports) shows several results that can have an impact on the price change:
Horizontal resistance is broken
Type : Bullish
Timeframe : Daily
Resistance of channel is broken
Type : Bullish
Timeframe : Daily
The Central Candlesticks scanner, specialised in Japanese candlesticks, did not identify any signals.
| S3 | S2 | S1 | Price | R1 | R2 | R3 | |
|---|---|---|---|---|---|---|---|
| ProTrendLines | 20.6449 | 20.8588 | 21.4993 | 21.5334 | 21.9263 | 23.0583 | 25.3263 |
| Change (%) | -4.13% | -3.13% | -0.16% | - | +1.82% | +7.08% | +17.61% |
| Change | -0.8885 | -0.6746 | -0.0341 | - | +0.3929 | +1.5249 | +3.7929 |
| Level | Major | Major | Intermediate | - | Major | Minor | Major |
Attention could also be paid to pivot points to set price objectives:
| Pivot points | S3 | S2 | S1 | PP | R1 | R2 | R3 |
|---|---|---|---|---|---|---|---|
| Standard | 20.8040 | 21.0060 | 21.2118 | 21.4138 | 21.6196 | 21.8216 | 22.0274 |
| Camarilla | 21.3056 | 21.3429 | 21.3803 | 21.4177 | 21.4551 | 21.4925 | 21.5299 |
| Woodie | 20.8060 | 21.0070 | 21.2138 | 21.4148 | 21.6216 | 21.8226 | 22.0294 |
| Fibonacci | 21.0060 | 21.1618 | 21.2580 | 21.4138 | 21.5696 | 21.6658 | 21.8216 |
| Pivot points | S3 | S2 | S1 | PP | R1 | R2 | R3 |
|---|---|---|---|---|---|---|---|
| Standard | 20.1612 | 20.3154 | 20.5813 | 20.7355 | 21.0014 | 21.1556 | 21.4215 |
| Camarilla | 20.7316 | 20.7701 | 20.8086 | 20.8471 | 20.8856 | 20.9241 | 20.9626 |
| Woodie | 20.2170 | 20.3433 | 20.6371 | 20.7634 | 21.0572 | 21.1835 | 21.4773 |
| Fibonacci | 20.3154 | 20.4759 | 20.5751 | 20.7355 | 20.8960 | 20.9952 | 21.1556 |
| Pivot points | S3 | S2 | S1 | PP | R1 | R2 | R3 |
|---|---|---|---|---|---|---|---|
| Standard | 19.3691 | 19.7440 | 20.1537 | 20.5286 | 20.9383 | 21.3132 | 21.7229 |
| Camarilla | 20.3477 | 20.4197 | 20.4916 | 20.5635 | 20.6354 | 20.7073 | 20.7793 |
| Woodie | 19.3866 | 19.7527 | 20.1712 | 20.5373 | 20.9558 | 21.3219 | 21.7404 |
| Fibonacci | 19.7440 | 20.0437 | 20.2289 | 20.5286 | 20.8283 | 21.0135 | 21.3132 |
Numerical data
The following is the status of technical indicators and moving averages registered at the time this technical analysis was created:
| RSI (14): | 74.75 | |
| MACD (12,26,9): | 0.2317 | |
| Directional Movement: | 28.3545 | |
| AROON (14): | 78.5714 | |
| DEMA (21): | 21.0869 | |
| Parabolic SAR (0,02-0,02-0,2): | 20.6182 | |
| Elder Ray (13): | 0.4928 | |
| Super Trend (3,10): | 20.7069 | |
| Zig ZAG (10): | 21.5364 | |
| VORTEX (21): | 1.2287 | |
| Stochastique (14,3,5): | 91.76 | |
| TEMA (21): | 21.2364 | |
| Williams %R (14): | -6.47 | |
| Chande Momentum Oscillator (20): | 1.2044 | |
| Repulse (5,40,3): | 2.3806 | |
| ROCnROLL: | 1 | |
| TRIX (15,9): | 0.0906 | |
| Courbe Coppock: | 5.85 |
| MA7: | 21.0726 | |
| MA20: | 20.7456 | |
| MA50: | 20.5197 | |
| MA100: | 20.2649 | |
| MAexp7: | 21.1547 | |
| MAexp20: | 20.8232 | |
| MAexp50: | 20.5620 | |
| MAexp100: | 20.3820 | |
| Price / MA7: | +2.19% | |
| Price / MA20: | +3.80% | |
| Price / MA50: | +4.94% | |
| Price / MA100: | +6.26% | |
| Price / MAexp7: | +1.79% | |
| Price / MAexp20: | +3.41% | |
| Price / MAexp50: | +4.72% | |
| Price / MAexp100: | +5.65% |
News
The last news published on USD/MXN at the time of the generation of this analysis was as follows:
-
 USD/ZAR and USD/MXN Forecast November 24, 2021
-
USD/MXN Forecast June 11, 2021
-
USD/MXN Forecast September 15, 2020
-
USD/MXN Forecast September 14, 2020
-
USD/MXN Forecast September 9, 2020
About author

Online


Add a comment
Comments
0 comments on the analysis USD/MXN - Daily