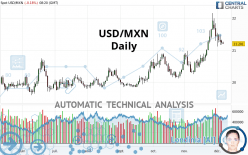
USD/MXN - Daily - Technical analysis published on 12/07/2021 (GMT)
- 234
- 0
Click here for a new analysis!
- Timeframe : Daily
- - Analysis generated on
- Status : INVALID

Summary of the analysis

Additional analysis
Quotes
USD/MXN rating 21.2010 MXN. The price is lower by -0.18% since the last closing with the lowest point at 21.1861 MXN and the highest point at 21.2660 MXN. The deviation from the price is +0.07% for the low point and -0.31% for the high point.A bearish opening was detected by the Central Gaps scanner. Sellers are trying to impose a bearish trend in the very short term.
Bearish opening
Type : Bearish
Timeframe : Openning
A study of price movements over other periods shows the following variations:
Near a new HIGH record (1st january)
Type : Bullish
Timeframe : Weekly
Near a new HIGH record (1 month)
Type : Bullish
Timeframe : Weekly
The Central Volumes scanner detects abnormal volumes on the asset:
Abnormal volumes
Timeframe : 5 days
Abnormal volumes
Timeframe : 20 days
Technical
Technical analysis of this Daily chart of USD/MXN indicates that the overall trend is strongly bullish. The signals given by the moving averages are 92.86% bullish. This strong bullish trend is confirmed by the strong signals currently being given by short-term moving averages. The Central Indicators scanner detects bullish signals on moving averages that could impact this trend:
Bullish trend reversal : adaptative moving average 20
Type : Bullish
Timeframe : Daily
Bullish trend reversal : adaptative moving average 50
Type : Bullish
Timeframe : Daily
Bullish price crossover with Moving Average 20
Type : Bullish
Timeframe : Daily
Bullish price crossover with adaptative moving average 20
Type : Bullish
Timeframe : Daily
Bullish price crossover with adaptative moving average 50
Type : Bullish
Timeframe : Daily
The technical indicators are generally neutral. They do not provide relevant information on the direction of future price movements.
Other results related to technical indicators were also found by the Central Indicators scanner:
RSI indicator is back over 50
Type : Bullish
Timeframe : Daily
SuperTrend indicator bullish reversal
Type : Bullish
Timeframe : Daily
Momentum indicator is back over 0
Type : Bullish
Timeframe : Daily
Williams %R indicator is back over -50
Type : Bullish
Timeframe : Daily
Central Patterns, the scanner specializing in chart patterns, did not identify any signals.
The Central Candlesticks scanner, specialised in Japanese candlesticks, did not identify any signals.
| S3 | S2 | S1 | Price | R1 | R2 | R3 | |
|---|---|---|---|---|---|---|---|
| ProTrendLines | 20.3655 | 20.6449 | 20.8588 | 21.2010 | 21.4993 | 21.9263 | 23.0583 |
| Change (%) | -3.94% | -2.62% | -1.61% | - | +1.41% | +3.42% | +8.76% |
| Change | -0.8355 | -0.5561 | -0.3422 | - | +0.2983 | +0.7253 | +1.8573 |
| Level | Minor | Intermediate | Intermediate | - | Intermediate | Major | Minor |
To determine price objectives, it is also possible to use the pivot points. Here is the price position in relation to pivot points:
| Pivot points | S3 | S2 | S1 | PP | R1 | R2 | R3 |
|---|---|---|---|---|---|---|---|
| Standard | 21.0163 | 21.0939 | 21.1663 | 21.2439 | 21.3163 | 21.3939 | 21.4663 |
| Camarilla | 21.1974 | 21.2111 | 21.2249 | 21.2386 | 21.2524 | 21.2661 | 21.2799 |
| Woodie | 21.0136 | 21.0926 | 21.1636 | 21.2426 | 21.3136 | 21.3926 | 21.4636 |
| Fibonacci | 21.0939 | 21.1512 | 21.1866 | 21.2439 | 21.3012 | 21.3366 | 21.3939 |
| Pivot points | S3 | S2 | S1 | PP | R1 | R2 | R3 |
|---|---|---|---|---|---|---|---|
| Standard | 17.0910 | 18.3954 | 19.5467 | 20.8511 | 22.0024 | 23.3068 | 24.4581 |
| Camarilla | 20.0228 | 20.2479 | 20.4730 | 20.6981 | 20.9232 | 21.1483 | 21.3734 |
| Woodie | 17.0146 | 18.3571 | 19.4703 | 20.8128 | 21.9260 | 23.2685 | 24.3817 |
| Fibonacci | 18.3954 | 19.3334 | 19.9130 | 20.8511 | 21.7891 | 22.3687 | 23.3068 |
| Pivot points | S3 | S2 | S1 | PP | R1 | R2 | R3 |
|---|---|---|---|---|---|---|---|
| Standard | 17.7895 | 18.9542 | 19.8261 | 20.9908 | 21.8627 | 23.0274 | 23.8993 |
| Camarilla | 20.1380 | 20.3247 | 20.5114 | 20.6981 | 20.8848 | 21.0715 | 21.2582 |
| Woodie | 17.6432 | 18.8810 | 19.6798 | 20.9176 | 21.7164 | 22.9542 | 23.7530 |
| Fibonacci | 18.9542 | 19.7322 | 20.2128 | 20.9908 | 21.7688 | 22.2494 | 23.0274 |
Numerical data
The following is the status of technical indicators and moving averages registered at the time this technical analysis was created:
| RSI (14): | 53.45 | |
| MACD (12,26,9): | 0.1059 | |
| Directional Movement: | 14.8739 | |
| AROON (14): | 7.1429 | |
| DEMA (21): | 21.1929 | |
| Parabolic SAR (0,02-0,02-0,2): | 19.7488 | |
| Elder Ray (13): | 0.1587 | |
| Super Trend (3,10): | 19.5090 | |
| Zig ZAG (10): | 21.1967 | |
| VORTEX (21): | 1.1242 | |
| Stochastique (14,3,5): | 54.76 | |
| TEMA (21): | 21.1542 | |
| Williams %R (14): | -38.98 | |
| Chande Momentum Oscillator (20): | -0.0683 | |
| Repulse (5,40,3): | -1.7665 | |
| ROCnROLL: | 1 | |
| TRIX (15,9): | 0.1241 | |
| Courbe Coppock: | 2.07 |
| MA7: | 21.0103 | |
| MA20: | 21.0801 | |
| MA50: | 20.7228 | |
| MA100: | 20.3878 | |
| MAexp7: | 21.0525 | |
| MAexp20: | 21.0211 | |
| MAexp50: | 20.7674 | |
| MAexp100: | 20.5302 | |
| Price / MA7: | +0.91% | |
| Price / MA20: | +0.57% | |
| Price / MA50: | +2.31% | |
| Price / MA100: | +3.99% | |
| Price / MAexp7: | +0.71% | |
| Price / MAexp20: | +0.86% | |
| Price / MAexp50: | +2.09% | |
| Price / MAexp100: | +3.27% |
News
Don't forget to follow the news on USD/MXN. At the time of publication of this analysis, the latest news was as follows:
-
 USD/ZAR and USD/MXN Forecast November 24, 2021
-
USD/MXN Forecast June 11, 2021
-
USD/MXN Forecast September 15, 2020
-
USD/MXN Forecast September 14, 2020
-
USD/MXN Forecast September 9, 2020
About author

Online


Add a comment
Comments
0 comments on the analysis USD/MXN - Daily