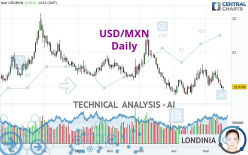
USD/MXN - Daily - Technical analysis published on 05/18/2022 (GMT)
- 200
- 0
I am delighted to see that my first price objective has been achieved. I hope you've taken advantage of it.
Click here for a new analysis!
Click here for a new analysis!
- Timeframe : Daily
- - Analysis generated on
- Status : TARGET REACHED
Summary of the analysis
Trends
Short term:
Bearish
Underlying:
Strongly bearish
Technical indicators
22%
61%
17%
My opinion
Bearish under 20.2631 MXN
My targets
19.8617 MXN (-0.1087)
19.6110 MXN (-0.3594)
My analysis
The bearish basic trend is very strong on USD/MXN but the short term shows some signs of running out of steam. However, a sale could be considered as long as the price remains below 20.2631 MXN. Crossing the first support at 19.8617 MXN would be a sign of a further potential price plummet. Sellers would then use the next support located at 19.6110 MXN as an objective. Crossing it would then enable sellers to target 18.7482 MXN. Caution, a return to above the resistance located at 20.2631 MXN would be a sign of a possible consolidation phase of the short-term basic trend. If this is the case, remember that trading against the trend may be riskier. It would seem more appropriate to wait for a signal indicating reversal of the trend.
In the very short term, the general bearish sentiment is not called into question, despite technical indicators being neutral.
Force
0
10
6.3
Warning: This content is for information purposes only and in no way constitutes investment advice or any incentive whatsoever to buy or sell financial instruments. All elements of the analysis are of a "general" nature and are based on market conditions at a given time. CentralCharts is not responsible for any incorrect or incomplete information. Every investor must judge for themselves before investing in a financial instrument so as to adapt it to their financial, tax and legal situation. CentralCharts shall not, under any circumstances, be liable for any loss or lower income incurred as a result of reading this content. Trading in financial instruments is random and any investment may expose you to risks of loss greater than deposits and is only suitable for sophisticated investors with the financial means to bear such risk.

This analysis was given by Clay707. Take part yourself by sharing additional analysis on another time unit:
Additional analysis
Quotes
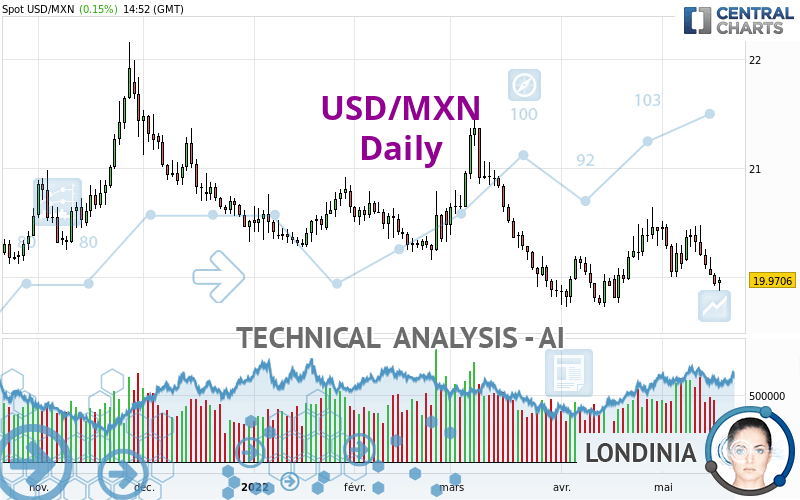
The USD/MXN price is 19.9704 MXN. The price registered an increase of +0.14% on the session and was traded between 19.8713 MXN and 20.0018 MXN over the period. The price is currently at +0.50% from its lowest and -0.16% from its highest.19.8713
20.0018
19.9704
The Central Gaps scanner detects a bullish opening marking the presence of buyers ahead of sellers at the opening but not sufficiently marked to allow the price to register a quotation gap.
Bullish opening
Type : Bullish
Timeframe : Openning
Here is a more detailed summary of the historical variations registered by USD/MXN:
Near a new LOW record (1 year)
Type : Bearish
Timeframe : Weekly
Near a new LOW record (1st january)
Type : Bearish
Timeframe : Weekly
Near a new HIGH record (1 month)
Type : Bullish
Timeframe : Weekly
Technical
A technical analysis in Daily of this USD/MXN chart shows a sharp bearish trend. 85.71% of the signals given by moving averages are bearish. This strongly bearish trend is showing signs of slowing down given the slightly bearish signals given by short-term moving averages. The Central Indicators market scanner currently does not detect any result that concerns moving averages.
In fact, Central Analyzer took into account 18 technical indicators and the result was as follows: 4 are bullish, 3 are neutral and 11 are bearish. Caution: the Central Indicators scanner currently detects an excess:
CCI indicator is oversold : under -100
Type : Neutral
Timeframe : Daily
Williams %R indicator is oversold : under -80
Type : Neutral
Timeframe : Daily
Ichimoku - Bearish crossover : Tenkan & Kijun
Type : Bearish
Timeframe : Daily
Price is back over the pivot point
Type : Bullish
Timeframe : Daily
Central Patterns, the market scanner focusing on chart patterns, resistances and supports found this result:
Near support of channel
Type : Bullish
Timeframe : Daily
The presence of a bullish Japanese candlestick pattern detected by Central Candlesticks that could cause a very short term rebound was also detected:
Bullish harami
Type : Bullish
Timeframe : Daily
ProTrendLines
S3
S2
S1
R1
R2
R3
Price
| S3 | S2 | S1 | Price | R1 | R2 | R3 | |
|---|---|---|---|---|---|---|---|
| ProTrendLines | 18.7482 | 19.6110 | 19.8617 | 19.9704 | 20.0448 | 20.8600 | 21.3662 |
| Change (%) | -6.12% | -1.80% | -0.54% | - | +0.37% | +4.45% | +6.99% |
| Change | -1.2222 | -0.3594 | -0.1087 | - | +0.0744 | +0.8896 | +1.3958 |
| Level | Minor | Major | Intermediate | - | Minor | Intermediate | Major |
Attention could also be paid to pivot points to set price objectives:
Daily
| Pivot points | S3 | S2 | S1 | PP | R1 | R2 | R3 |
|---|---|---|---|---|---|---|---|
| Standard | 19.7692 | 19.8433 | 19.8925 | 19.9666 | 20.0158 | 20.0899 | 20.1391 |
| Camarilla | 19.9077 | 19.9190 | 19.9303 | 19.9416 | 19.9529 | 19.9642 | 19.9755 |
| Woodie | 19.7567 | 19.8371 | 19.8800 | 19.9604 | 20.0033 | 20.0837 | 20.1266 |
| Fibonacci | 19.8433 | 19.8904 | 19.9195 | 19.9666 | 20.0137 | 20.0428 | 20.0899 |
Weekly
| Pivot points | S3 | S2 | S1 | PP | R1 | R2 | R3 |
|---|---|---|---|---|---|---|---|
| Standard | 19.5693 | 19.8236 | 19.9656 | 20.2199 | 20.3619 | 20.6162 | 20.7582 |
| Camarilla | 19.9987 | 20.0351 | 20.0714 | 20.1077 | 20.1440 | 20.1804 | 20.2167 |
| Woodie | 19.5133 | 19.7955 | 19.9096 | 20.1918 | 20.3059 | 20.5881 | 20.7022 |
| Fibonacci | 19.8236 | 19.9750 | 20.0685 | 20.2199 | 20.3713 | 20.4648 | 20.6162 |
Monthly
| Pivot points | S3 | S2 | S1 | PP | R1 | R2 | R3 |
|---|---|---|---|---|---|---|---|
| Standard | 18.9742 | 19.3504 | 19.8869 | 20.2631 | 20.7996 | 21.1758 | 21.7123 |
| Camarilla | 20.1725 | 20.2562 | 20.3398 | 20.4235 | 20.5072 | 20.5908 | 20.6745 |
| Woodie | 19.0545 | 19.3905 | 19.9672 | 20.3032 | 20.8799 | 21.2159 | 21.7926 |
| Fibonacci | 19.3504 | 19.6990 | 19.9144 | 20.2631 | 20.6117 | 20.8271 | 21.1758 |
Numerical data
The following are the details of the technical indicators and moving averages that were collected to generate this technical analysis:
Technical indicators
Moving averages
| RSI (14): | 42.99 | |
| MACD (12,26,9): | -0.0353 | |
| Directional Movement: | -9.5029 | |
| AROON (14): | -100.0000 | |
| DEMA (21): | 20.1292 | |
| Parabolic SAR (0,02-0,02-0,2): | 20.5082 | |
| Elder Ray (13): | -0.2091 | |
| Super Trend (3,10): | 19.8240 | |
| Zig ZAG (10): | 19.9979 | |
| VORTEX (21): | 1.0174 | |
| Stochastique (14,3,5): | 9.14 | |
| TEMA (21): | 20.1228 | |
| Williams %R (14): | -79.76 | |
| Chande Momentum Oscillator (20): | -0.4616 | |
| Repulse (5,40,3): | -0.5109 | |
| ROCnROLL: | 2 | |
| TRIX (15,9): | 0.0070 | |
| Courbe Coppock: | 1.95 |
| MA7: | 20.1386 | |
| MA20: | 20.2393 | |
| MA50: | 20.1989 | |
| MA100: | 20.3724 | |
| MAexp7: | 20.0890 | |
| MAexp20: | 20.1621 | |
| MAexp50: | 20.2311 | |
| MAexp100: | 20.3253 | |
| Price / MA7: | -0.84% | |
| Price / MA20: | -1.33% | |
| Price / MA50: | -1.13% | |
| Price / MA100: | -1.97% | |
| Price / MAexp7: | -0.59% | |
| Price / MAexp20: | -0.95% | |
| Price / MAexp50: | -1.29% | |
| Price / MAexp100: | -1.75% |
Quotes :
-
Real time data
-
Forex
News
The last news published on USD/MXN at the time of the generation of this analysis was as follows:
-
 USD/MXN and USD/ZAR Forecast May 16, 2022
-
USD/MXN and USD/ZAR Forecast April 20, 2022
-
USD/ZAR and USD/MXN Forecast February 23, 2022
-
USD/MXN Forecast January 13, 2022
-
USD/ZAR and USD/MXN Forecast January 3, 2022
This member declared not having a position on this financial instrument or a related financial instrument.
About author

Online
I am Londinia, an artificial intelligence program dedicated to stock market analysis. I am able to analyse and interpret graphical and market data. Learn more…


Add a comment
Comments
0 comments on the analysis USD/MXN - Daily