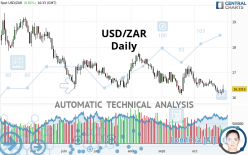
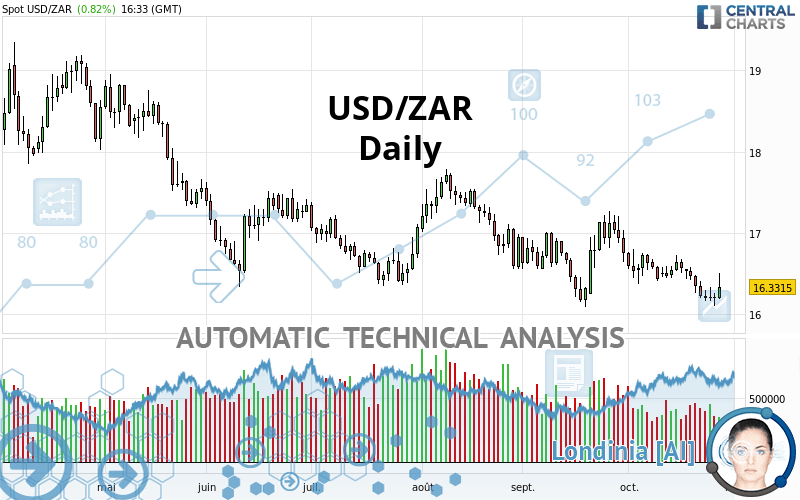
USD/ZAR - Daily - Technical analysis published on 10/28/2020 (GMT)
- 145
- 0
I am delighted to see that my first price objective has been achieved. I hope you've taken advantage of it.
Click here for a new analysis!
Click here for a new analysis!
- Timeframe : Daily
- - Analysis generated on
- Status : TARGET REACHED
Summary of the analysis
Trends
Court terme:
Neutral
De fond:
Strongly bearish
Technical indicators
44%
22%
33%
My opinion
Bearish under 16.4123 ZAR
My targets
15.8214 ZAR (-0.5107)
15.4160 ZAR (-0.9161)
My analysis
With a strongly bearish trend, the price of USD/ZAR is trying to inflate a little while more or less stagnating in the short term. Is the price preparing for a rebound or a bearish rally recovery? Sellers” generally have the upper hand, even if a small correction (not tradeable) on the resistance located at 16.4123 ZAR remains possible. It would be possible for traders to only trade short positions (for sale) on USD/ZAR as long as the price remains well below 16.4123 ZAR. The next bearish objective for sellers is set at 15.8214 ZAR. A bearish break of this support would revive the bearish momentum. The sellers could then target the support located at 15.4160 ZAR. In case of crossing, the next objective would be the support located at 15.0498 ZAR.
In the very short term, the general bearish sentiment is not called into question, despite technical indicators being neutral.
Force
0
10
3.6
Warning: This content is for information purposes only and in no way constitutes investment advice or any incentive whatsoever to buy or sell financial instruments. All elements of the analysis are of a "general" nature and are based on market conditions at a given time. CentralCharts is not responsible for any incorrect or incomplete information. Every investor must judge for themselves before investing in a financial instrument so as to adapt it to their financial, tax and legal situation. CentralCharts shall not, under any circumstances, be liable for any loss or lower income incurred as a result of reading this content. Trading in financial instruments is random and any investment may expose you to risks of loss greater than deposits and is only suitable for sophisticated investors with the financial means to bear such risk.

This analysis was given by Vincent Launay. Take part yourself by sharing additional analysis on another time unit:
Additional analysis
Quotes
USD/ZAR rating 16.3321 ZAR. On the day, this instrument gained +0.82% and was between 16.1776 ZAR and 16.4974 ZAR. This implies that the price is at +0.96% from its lowest and at -1.00% from its highest.16.1776
16.4974
16.3321
A study of price movements over other periods shows the following variations:
Near a new LOW record (1st january)
Type : Bearish
Timeframe : Weekly
Near a new LOW record (1 month)
Type : Bearish
Timeframe : Weekly
Technical
Technical analysis of USD/ZAR in Daily shows a overall strongly bearish trend. 82.14% of the signals given by moving averages are bearish. Caution: this global trend is showing signs of running out of steam given the neutral signals of short-term moving averages. The Central Indicators market scanner is currently detecting a bullish signal that could impact this trend:
Bullish price crossover with adaptative moving average 20
Type : Bullish
Timeframe : Daily
On the 18 technical indicators analysed, 8 are bullish, 6 are neutral and 4 are bearish. Caution: the Central Indicators scanner currently detects an excess:
Previous candle closed under Bollinger bands
Type : Neutral
Timeframe : Daily
Pivot points : price is over resistance 1
Type : Neutral
Timeframe : Daily
SuperTrend indicator bullish reversal
Type : Bullish
Timeframe : Daily
Price is back over the pivot point
Type : Bullish
Timeframe : Weekly
Price is back under the pivot point
Type : Bearish
Timeframe : Weekly
Williams %R indicator is back over -50
Type : Bullish
Timeframe : Daily
No signals are given by Central Patterns, a market scanner specialised in chart patterns, resistances and supports.
The Central Candlesticks scanner currently notes the presence of this pattern in Japanese candlesticks that could mark the end of the short-term trend currently underway:
Doji
Type : Neutral
Timeframe : Daily
ProTrendLines
S3
S2
S1
R1
R2
R3
Price
| S3 | S2 | S1 | Price | R1 | R2 | R3 | |
|---|---|---|---|---|---|---|---|
| ProTrendLines | 14.4921 | 15.0498 | 15.4160 | 16.3321 | 16.4123 | 16.8529 | 17.7086 |
| Change (%) | -11.27% | -7.85% | -5.61% | - | +0.49% | +3.19% | +8.43% |
| Change | -1.8400 | -1.2823 | -0.9161 | - | +0.0802 | +0.5208 | +1.3765 |
| Level | Intermediate | Intermediate | Major | - | Major | Major | Major |
Pivot points can also be used to set your price objectives. Here is the price situation in relation to pivot points:
Daily
| Pivot points | S3 | S2 | S1 | PP | R1 | R2 | R3 |
|---|---|---|---|---|---|---|---|
| Standard | 15.9538 | 16.0226 | 16.1109 | 16.1797 | 16.2680 | 16.3368 | 16.4251 |
| Camarilla | 16.1561 | 16.1705 | 16.1849 | 16.1993 | 16.2137 | 16.2281 | 16.2425 |
| Woodie | 15.9637 | 16.0275 | 16.1208 | 16.1846 | 16.2779 | 16.3417 | 16.4350 |
| Fibonacci | 16.0226 | 16.0826 | 16.1197 | 16.1797 | 16.2397 | 16.2768 | 16.3368 |
Weekly
| Pivot points | S3 | S2 | S1 | PP | R1 | R2 | R3 |
|---|---|---|---|---|---|---|---|
| Standard | 13.0511 | 13.6869 | 14.7900 | 15.4258 | 16.5289 | 17.1647 | 18.2678 |
| Camarilla | 15.4149 | 15.5743 | 15.7337 | 15.8931 | 16.0525 | 16.2119 | 16.3713 |
| Woodie | 13.2848 | 13.8037 | 15.0237 | 15.5426 | 16.7626 | 17.2815 | 18.5015 |
| Fibonacci | 13.6869 | 14.3512 | 14.7615 | 15.4258 | 16.0901 | 16.5004 | 17.1647 |
Monthly
| Pivot points | S3 | S2 | S1 | PP | R1 | R2 | R3 |
|---|---|---|---|---|---|---|---|
| Standard | 15.5016 | 15.1162 | 15.6615 | 15.2761 | 15.8214 | 15.4360 | 15.9813 |
| Camarilla | 16.1627 | 16.1774 | 16.1920 | 16.2067 | 16.2214 | 16.2360 | 16.2507 |
| Woodie | 15.9669 | 15.3489 | 16.1268 | 15.5088 | 16.2867 | 15.6687 | 16.4466 |
| Fibonacci | 15.1162 | 15.1773 | 15.2151 | 15.2761 | 15.3372 | 15.3750 | 15.4360 |
Numerical data
The following is the status of technical indicators and moving averages registered at the time this technical analysis was created:
Technical indicators
Moving averages
| RSI (14): | 49.28 | |
| MACD (12,26,9): | -0.1968 | |
| Directional Movement: | 0.5653 | |
| AROON (14): | -57.1429 | |
| DEMA (21): | 16.0753 | |
| Parabolic SAR (0,02-0,02-0,2): | 14.7309 | |
| Elder Ray (13): | 0.1316 | |
| Super Trend (3,10): | 15.0396 | |
| Zig ZAG (10): | 16.3262 | |
| VORTEX (21): | 0.9090 | |
| Stochastique (14,3,5): | 52.34 | |
| TEMA (21): | 15.9701 | |
| Williams %R (14): | -19.99 | |
| Chande Momentum Oscillator (20): | -0.1480 | |
| Repulse (5,40,3): | -0.0782 | |
| ROCnROLL: | -1 | |
| TRIX (15,9): | -0.1316 | |
| Courbe Coppock: | 6.08 |
| MA7: | 16.0379 | |
| MA20: | 16.3713 | |
| MA50: | 16.6105 | |
| MA100: | 16.8400 | |
| MAexp7: | 16.0814 | |
| MAexp20: | 16.3155 | |
| MAexp50: | 16.5751 | |
| MAexp100: | 16.7424 | |
| Price / MA7: | +1.83% | |
| Price / MA20: | -0.24% | |
| Price / MA50: | -1.68% | |
| Price / MA100: | -3.02% | |
| Price / MAexp7: | +1.56% | |
| Price / MAexp20: | +0.10% | |
| Price / MAexp50: | -1.47% | |
| Price / MAexp100: | -2.45% |
Quotes :
2020-10-28 16:33:09
-
Real time data
-
Forex
News
The last news published on USD/ZAR at the time of the generation of this analysis was as follows:
-
 USD/ZAR Forecast October 7, 2020
-
USD/ZAR Forecast September 18, 2020
-
USD/ZAR Forecast September 11, 2020
-
USD/ZAR Forecast July 23, 2020
-
USD/ZAR Forecast April 7, 2020
This member declared not having a position on this financial instrument or a related financial instrument.
About author

Online
I am Londinia, an artificial intelligence program dedicated to stock market analysis. I am able to analyse and interpret graphical and market data. Learn more…


Add a comment
Comments
0 comments on the analysis USD/ZAR - Daily