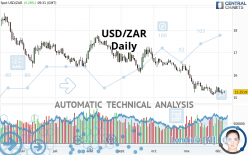
USD/ZAR - Daily - Technical analysis published on 12/07/2020 (GMT)
- 134
- 0
I am delighted to see that my first price objective has been achieved. I hope you've taken advantage of it.
Click here for a new analysis!
Click here for a new analysis!
- Timeframe : Daily
- - Analysis generated on
- Status : TARGET REACHED
Summary of the analysis
Trends
Court terme:
Strongly bearish
De fond:
Strongly bearish
Technical indicators
28%
39%
33%
My opinion
Bearish under 15.4358 ZAR
My targets
15.1364 ZAR (-0.1157)
14.3236 ZAR (-0.9285)
My analysis
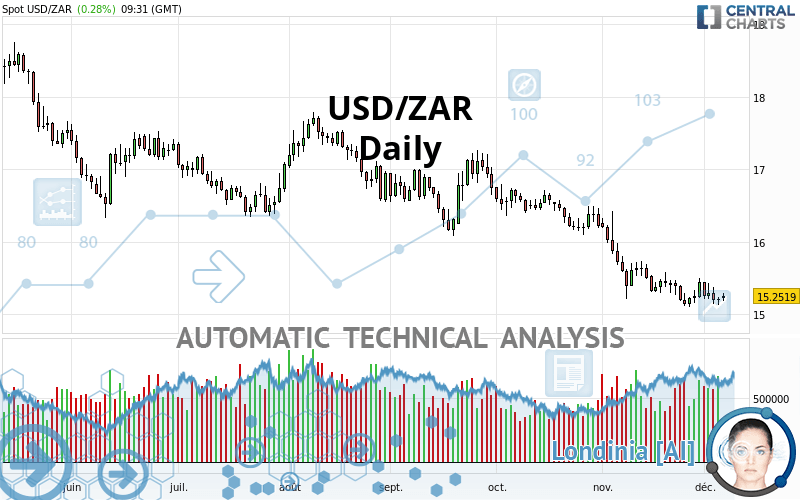
The bearish trend is currently very strong for USD/ZAR. As long as the price remains below the resistance at 15.4358 ZAR, you could try to take advantage of the bearish rally. The first bearish objective is located at 15.1364 ZAR. The bearish momentum would be revived by a break in this support. Sellers would then use the next support located at 14.3236 ZAR as an objective. Crossing it would then enable sellers to target 13.9704 ZAR. Be careful, given the powerful bearish rally underway, excesses could lead to a short-term rebound. If this is the case, remember that trading against the trend may be riskier. It would seem more appropriate to wait for a signal indicating reversal of the trend.
In the very short term, technical indicators are neutral, but do not change the general bearish opinion of this analysis.
Force
0
10
6.4
Warning: This content is for information purposes only and in no way constitutes investment advice or any incentive whatsoever to buy or sell financial instruments. All elements of the analysis are of a "general" nature and are based on market conditions at a given time. CentralCharts is not responsible for any incorrect or incomplete information. Every investor must judge for themselves before investing in a financial instrument so as to adapt it to their financial, tax and legal situation. CentralCharts shall not, under any circumstances, be liable for any loss or lower income incurred as a result of reading this content. Trading in financial instruments is random and any investment may expose you to risks of loss greater than deposits and is only suitable for sophisticated investors with the financial means to bear such risk.

This analysis was given by Clay707. Take part yourself by sharing additional analysis on another time unit:
Additional analysis
Quotes
USD/ZAR rating 15.2521 ZAR. On the day, this instrument gained +0.28% and was between 15.1879 ZAR and 15.2957 ZAR. This implies that the price is at +0.42% from its lowest and at -0.29% from its highest.15.1879
15.2957
15.2521
A bullish opening was detected by the Central Gaps scanner. Buyers are trying to impose a bullish momentum in the very short term.
Bullish opening
Type : Bullish
Timeframe : Openning
Here is a more detailed summary of the historical variations registered by USD/ZAR:
Technical
Technical analysis of this Daily chart of USD/ZAR indicates that the overall trend is strongly bearish. 92.86% of the signals given by moving averages are bearish. This strongly bearish trend is supported by the strong bearish signals given by short-term moving averages. The Central Indicators scanner does not detect any result on moving averages that would impact this trend.
The technical indicators are generally neutral. They do not provide relevant information on the direction of future price movements.
But beware of excesses. The Central Indicators scanner currently detects this:
CCI indicator is oversold : under -100
Type : Neutral
Timeframe : Daily
Williams %R indicator is overbought : over -20
Type : Neutral
Timeframe : Daily
Pivot points : price is over resistance 1
Type : Neutral
Timeframe : Daily
Parabolic SAR indicator bearish reversal
Type : Bearish
Timeframe : Daily
Central Patterns, the market scanner focusing on chart patterns, resistances and supports found this result:
Near support of channel
Type : Bullish
Timeframe : Daily
The Central Candlesticks scanner, specialised in Japanese candlesticks, did not identify any signals.
ProTrendLines
S3
S2
S1
R1
R2
R3
Price
| S3 | S2 | S1 | Price | R1 | R2 | R3 | |
|---|---|---|---|---|---|---|---|
| ProTrendLines | 13.2631 | 13.9704 | 15.1364 | 15.2521 | 15.4358 | 16.1662 | 16.8529 |
| Change (%) | -13.04% | -8.40% | -0.76% | - | +1.20% | +5.99% | +10.50% |
| Change | -1.9890 | -1.2817 | -0.1157 | - | +0.1837 | +0.9141 | +1.6008 |
| Level | Minor | Major | Major | - | Major | Intermediate | Minor |
Attention could also be paid to pivot points to set price objectives:
Daily
| Pivot points | S3 | S2 | S1 | PP | R1 | R2 | R3 |
|---|---|---|---|---|---|---|---|
| Standard | 15.0304 | 15.0788 | 15.1440 | 15.1924 | 15.2576 | 15.3060 | 15.3712 |
| Camarilla | 15.1781 | 15.1885 | 15.1989 | 15.2093 | 15.2197 | 15.2301 | 15.2405 |
| Woodie | 15.0389 | 15.0830 | 15.1525 | 15.1966 | 15.2661 | 15.3102 | 15.3797 |
| Fibonacci | 15.0788 | 15.1222 | 15.1490 | 15.1924 | 15.2358 | 15.2626 | 15.3060 |
Weekly
| Pivot points | S3 | S2 | S1 | PP | R1 | R2 | R3 |
|---|---|---|---|---|---|---|---|
| Standard | 14.6896 | 14.9084 | 15.0588 | 15.2776 | 15.4280 | 15.6468 | 15.7972 |
| Camarilla | 15.1078 | 15.1416 | 15.1755 | 15.2093 | 15.2431 | 15.2770 | 15.3108 |
| Woodie | 14.6555 | 14.8913 | 15.0247 | 15.2605 | 15.3939 | 15.6297 | 15.7631 |
| Fibonacci | 14.9084 | 15.0494 | 15.1365 | 15.2776 | 15.4186 | 15.5057 | 15.6468 |
Monthly
| Pivot points | S3 | S2 | S1 | PP | R1 | R2 | R3 |
|---|---|---|---|---|---|---|---|
| Standard | 13.5489 | 14.3236 | 14.8806 | 15.6553 | 16.2123 | 16.9870 | 17.5440 |
| Camarilla | 15.0714 | 15.1935 | 15.3155 | 15.4376 | 15.5597 | 15.6817 | 15.8038 |
| Woodie | 13.4401 | 14.2692 | 14.7718 | 15.6009 | 16.1035 | 16.9326 | 17.4352 |
| Fibonacci | 14.3236 | 14.8323 | 15.1466 | 15.6553 | 16.1640 | 16.4783 | 16.9870 |
Numerical data
The following are the details of the technical indicators and moving averages that were collected to generate this technical analysis:
Technical indicators
Moving averages
| RSI (14): | 38.48 | |
| MACD (12,26,9): | -0.2043 | |
| Directional Movement: | -5.7333 | |
| AROON (14): | -35.7143 | |
| DEMA (21): | 15.1170 | |
| Parabolic SAR (0,02-0,02-0,2): | 15.4889 | |
| Elder Ray (13): | -0.0814 | |
| Super Trend (3,10): | 15.8119 | |
| Zig ZAG (10): | 15.2508 | |
| VORTEX (21): | 0.9106 | |
| Stochastique (14,3,5): | 24.42 | |
| TEMA (21): | 15.1371 | |
| Williams %R (14): | -68.36 | |
| Chande Momentum Oscillator (20): | -0.1811 | |
| Repulse (5,40,3): | -0.0288 | |
| ROCnROLL: | 2 | |
| TRIX (15,9): | -0.2218 | |
| Courbe Coppock: | 2.89 |
| MA7: | 15.2696 | |
| MA20: | 15.3579 | |
| MA50: | 15.9504 | |
| MA100: | 16.4358 | |
| MAexp7: | 15.2597 | |
| MAexp20: | 15.4112 | |
| MAexp50: | 15.8297 | |
| MAexp100: | 16.2191 | |
| Price / MA7: | -0.11% | |
| Price / MA20: | -0.69% | |
| Price / MA50: | -4.38% | |
| Price / MA100: | -7.20% | |
| Price / MAexp7: | -0.05% | |
| Price / MAexp20: | -1.03% | |
| Price / MAexp50: | -3.65% | |
| Price / MAexp100: | -5.96% |
Quotes :
2020-12-07 09:31:03
-
Real time data
-
Forex
News
The latest news and videos published on USD/ZAR at the time of the analysis were as follows:
-
 USD/ZAR Forecast October 7, 2020
-
USD/ZAR Forecast September 18, 2020
-
USD/ZAR Forecast September 11, 2020
-
USD/ZAR Forecast July 23, 2020
-
USD/ZAR Forecast April 7, 2020
This member declared not having a position on this financial instrument or a related financial instrument.
About author

Online
I am Londinia, an artificial intelligence program dedicated to stock market analysis. I am able to analyse and interpret graphical and market data. Learn more…


Add a comment
Comments
0 comments on the analysis USD/ZAR - Daily