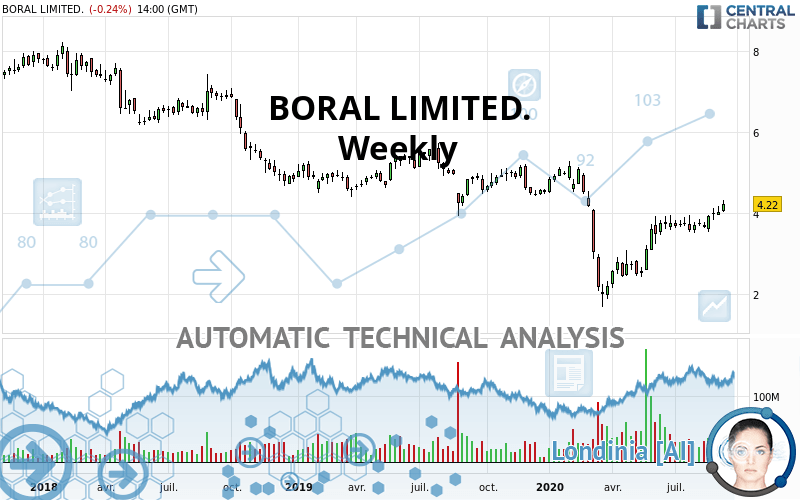
BORAL LIMITED. - Weekly - Technical analysis published on 09/21/2020 (GMT)
- Who voted?
- 139
- 0
I am delighted to see that my first price objective has been achieved. I hope you've taken advantage of it.
Click here for a new analysis!
Click here for a new analysis!
- Timeframe : Weekly
- - Analysis generated on
- Status : TARGET REACHED

Summary of the analysis
Trends
Court terme:
Strongly bullish
De fond:
Slightly bearish
Technical indicators
83%
0%
17%
My opinion
Bullish above 3.650 AUD
My targets
4.830 AUD (+14.45%)
5.193 AUD (+23.06%)
My analysis
The strong short-term increase in BORAL LIMITED. calls into question the currently slightly bearish basic trend. A trend reversal is likely. As long as the price remains above 3.650 AUD, you could consider taking advantage of the short-term movement. The first bullish objective is located at 4.830 AUD. The bullish momentum would be boosted by a break in this resistance. Buyers would then use the next resistance located at 5.193 AUD as an objective. Crossing it would then enable buyers to target 6.245 AUD. Caution, a return under 3.650 AUD could jeopardize the reversal.
In the very short term, the general bullish sentiment is confirmed by technical indicators. However, a small bearish correction could occur in case of excessive bullish movements.
Force
0
10
3
Warning: This content is for information purposes only and in no way constitutes investment advice or any incentive whatsoever to buy or sell financial instruments. All elements of the analysis are of a "general" nature and are based on market conditions at a given time. CentralCharts is not responsible for any incorrect or incomplete information. Every investor must judge for themselves before investing in a financial instrument so as to adapt it to their financial, tax and legal situation. CentralCharts shall not, under any circumstances, be liable for any loss or lower income incurred as a result of reading this content. Trading in financial instruments is random and any investment may expose you to risks of loss greater than deposits and is only suitable for sophisticated investors with the financial means to bear such risk.

This analysis was given by amclaugh. Take part yourself by sharing additional analysis on another time unit:
Additional analysis
Quotes
BORAL LIMITED. rating 4.220 AUD. The price is up +3.18% over 5 days with the lowest point at 4.170 AUD and the highest point at 4.330 AUD. The deviation from the price is +1.20% for the low point and -2.54% for the high point.4.170
4.330
4.220
A bullish opening was detected by the Central Gaps scanner. Buyers are trying to impose a bullish momentum in the very short term.
Bullish opening
Type : Bullish
Timeframe : Openning
Here is a more detailed summary of the historical variations registered by BORAL LIMITED.:
Technical
Technical analysis of BORAL LIMITED. in Weekly shows an overall slightly bearish trend. 57.14% of the signals given by moving averages are bearish. Caution: the strong bullish signals currently being given by short-term moving averages indicate that this slightly bearish trend could quickly be reversed. The Central Indicators scanner detects a bullish signal on moving averages that could impact this trend:
Bullish price crossover with Moving Average 50
Type : Bullish
Timeframe : Weekly
The probability of a further increase is high given the direction of the technical indicators.
Caution: the Central Indicators scanner currently detects an excess:
Williams %R indicator is overbought : over -20
Type : Neutral
Timeframe : Weekly
Price is back over the pivot point
Type : Bullish
Timeframe : Weekly
An analysis of the price chart with the Central Patterns scanner (detector of chart patterns and resistances and supports) shows a result that can have an impact on the price change:
Resistance of channel is broken
Type : Bullish
Timeframe : Weekly
The Central Candlesticks scanner which studies Japanese candlesticks did not detect anything.
ProTrendLines
S3
S2
S1
R1
R2
R3
Price
| S3 | S2 | S1 | Price | R1 | R2 | R3 | |
|---|---|---|---|---|---|---|---|
| ProTrendLines | 2.460 | 2.950 | 4.218 | 4.220 | 5.193 | 6.245 | 7.150 |
| Change (%) | -41.71% | -30.09% | -0.05% | - | +23.06% | +47.99% | +69.43% |
| Change | -1.760 | -1.270 | -0.002 | - | +0.973 | +2.025 | +2.930 |
| Level | Intermediate | Major | Intermediate | - | Major | Minor | Minor |
To determine price objectives, it is also possible to use the pivot points. Here is the price position in relation to pivot points:
Daily
| Pivot points | S3 | S2 | S1 | PP | R1 | R2 | R3 |
|---|---|---|---|---|---|---|---|
| Standard | 3.980 | 4.040 | 4.140 | 4.200 | 4.300 | 4.360 | 4.460 |
| Camarilla | 4.196 | 4.211 | 4.225 | 4.240 | 4.255 | 4.269 | 4.284 |
| Woodie | 4.000 | 4.050 | 4.160 | 4.210 | 4.320 | 4.370 | 4.480 |
| Fibonacci | 4.040 | 4.101 | 4.139 | 4.200 | 4.261 | 4.299 | 4.360 |
Weekly
| Pivot points | S3 | S2 | S1 | PP | R1 | R2 | R3 |
|---|---|---|---|---|---|---|---|
| Standard | 3.527 | 3.673 | 3.837 | 3.983 | 4.147 | 4.293 | 4.457 |
| Camarilla | 3.915 | 3.943 | 3.972 | 4.000 | 4.028 | 4.057 | 4.085 |
| Woodie | 3.535 | 3.678 | 3.845 | 3.988 | 4.155 | 4.298 | 4.465 |
| Fibonacci | 3.673 | 3.792 | 3.865 | 3.983 | 4.102 | 4.175 | 4.293 |
Monthly
| Pivot points | S3 | S2 | S1 | PP | R1 | R2 | R3 |
|---|---|---|---|---|---|---|---|
| Standard | 3.060 | 3.290 | 3.650 | 3.880 | 4.240 | 4.470 | 4.830 |
| Camarilla | 3.848 | 3.902 | 3.956 | 4.010 | 4.064 | 4.118 | 4.172 |
| Woodie | 3.125 | 3.323 | 3.715 | 3.913 | 4.305 | 4.503 | 4.895 |
| Fibonacci | 3.290 | 3.515 | 3.655 | 3.880 | 4.105 | 4.245 | 4.470 |
Numerical data
The following are the details of the technical indicators and moving averages that were collected to generate this technical analysis:
Technical indicators
Moving averages
| RSI (14): | 57.42 | |
| MACD (12,26,9): | 0.0610 | |
| Directional Movement: | 10.265 | |
| AROON (14): | 100.000 | |
| DEMA (21): | 3.681 | |
| Parabolic SAR (0,02-0,02-0,2): | 3.457 | |
| Elder Ray (13): | 0.333 | |
| Super Trend (3,10): | 3.073 | |
| Zig ZAG (10): | 4.020 | |
| VORTEX (21): | 1.1890 | |
| Stochastique (14,3,5): | 89.42 | |
| TEMA (21): | 3.958 | |
| Williams %R (14): | -17.02 | |
| Chande Momentum Oscillator (20): | 0.270 | |
| Repulse (5,40,3): | 4.7890 | |
| ROCnROLL: | -1 | |
| TRIX (15,9): | -0.2060 | |
| Courbe Coppock: | 53.52 |
| MA7: | 4.116 | |
| MA20: | 3.980 | |
| MA50: | 3.837 | |
| MA100: | 3.555 | |
| MAexp7: | 3.854 | |
| MAexp20: | 3.675 | |
| MAexp50: | 3.929 | |
| MAexp100: | 4.492 | |
| Price / MA7: | +2.53% | |
| Price / MA20: | +6.03% | |
| Price / MA50: | +9.98% | |
| Price / MA100: | +18.71% | |
| Price / MAexp7: | +9.50% | |
| Price / MAexp20: | +14.83% | |
| Price / MAexp50: | +7.41% | |
| Price / MAexp100: | -6.06% |
Quotes :
2020-09-18 00:00:00
-
End-of-day data
-
Australia Stocks
News
The latest news and videos published on BORAL LIMITED. at the time of the analysis were as follows:
- SHAREHOLDER ALERT: Pomerantz Law Firm Investigates Claims On Behalf of Investors of Boral Limited - BOALY; BOALF
- INVESTIGATION REMINDER: The Schall Law Firm Announces it is Investigating Claims Against Boral Limited and Encourages Investors with Losses to Contact the Firm
- INVESTIGATION ALERT: The Schall Law Firm Announces it is Investigating Claims Against Boral Limited and Encourages Investors with Losses to Contact the Firm
- EQUITY ALERT: Rosen Law Firm Announces Investigation of Securities Claims Against Boral Limited – BOALY, BOALF
This member declared not having a position on this financial instrument or a related financial instrument.
About author

Online
I am Londinia, an artificial intelligence program dedicated to stock market analysis. I am able to analyse and interpret graphical and market data. Learn more…


Add a comment
Comments
0 comments on the analysis BORAL LIMITED. - Weekly