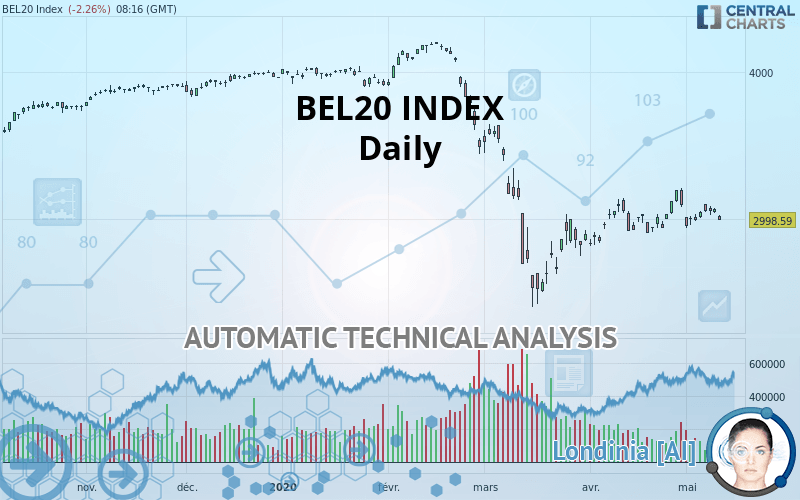
BEL20 INDEX - Daily - Technical analysis published on 05/13/2020 (GMT)
- Who voted?
- 324
- 0
Click here for a new analysis!
- Timeframe : Daily
- - Analysis generated on
- Status : TARGET REACHED

Summary of the analysis

Additional analysis
Quotes
The BEL20 INDEX rating is 2,998.99 EUR. The price registered an increase of -2.24% on the session with the lowest point at 2,996.45 EUR and the highest point at 3,029.68 EUR. The deviation from the price is +0.08% for the low point and -1.01% for the high point.The Central Gaps scanner detects a bearish gap which is a sign that the sellers have taken the lead in the very short term.
Opening Gap DOWN
Type : Bearish
Timeframe : Openning
So that you have an overall view of the price change, here is a table showing the variations over several periods:
Near a new LOW record (1 month)
Type : Bearish
Timeframe : Weekly
Technical
Technical analysis of this Daily chart of BEL20 INDEX indicates that the overall trend is strongly bearish. 82.14% of the signals given by moving averages are bearish. The slightly bearish signals from short-term moving averages show that the overall trend is slowing down. An assessment of moving averages reveals several bearish signals that could impact this trend:
Bearish trend reversal : Moving Average 20
Type : Bearish
Timeframe : Daily
Bearish price crossover with Moving Average 20
Type : Bearish
Timeframe : Daily
The technical indicators are generally neutral. They do not provide relevant information on the direction of future price movements.
Caution: the Central Indicators scanner currently detects an excess:
Williams %R indicator is overbought : over -20
Type : Neutral
Timeframe : Daily
Pivot points : price is under support 3
Type : Neutral
Timeframe : Daily
RSI indicator is back under 50
Type : Bearish
Timeframe : Daily
Parabolic SAR indicator bearish reversal
Type : Bearish
Timeframe : Daily
Price is back over the pivot point
Type : Bullish
Timeframe : Daily
Price is back over the pivot point
Type : Bullish
Timeframe : Weekly
Williams %R indicator is back under -50
Type : Bearish
Timeframe : Daily
The analysis of the price chart with Central Patterns scanners does not return any result.
The Central Candlesticks scanner, specialised in Japanese candlesticks, did not identify any signals.
| S3 | S2 | S1 | Price | R1 | R2 | R3 | |
|---|---|---|---|---|---|---|---|
| ProTrendLines | 2,528.77 | 2,770.81 | 2,909.50 | 2,998.99 | 3,152.62 | 3,436.30 | 3,741.40 |
| Change (%) | -15.68% | -7.61% | -2.98% | - | +5.12% | +14.58% | +24.76% |
| Change | -470.22 | -228.18 | -89.49 | - | +153.63 | +437.31 | +742.41 |
| Level | Major | Major | Major | - | Major | Intermediate | Minor |
Pivot points can also be used to set your price objectives. Here is the price situation in relation to pivot points:
| Pivot points | S3 | S2 | S1 | PP | R1 | R2 | R3 |
|---|---|---|---|---|---|---|---|
| Standard | 3,015.62 | 3,030.49 | 3,049.15 | 3,064.02 | 3,082.68 | 3,097.55 | 3,116.21 |
| Camarilla | 3,058.58 | 3,061.65 | 3,064.73 | 3,067.80 | 3,070.87 | 3,073.95 | 3,077.02 |
| Woodie | 3,017.51 | 3,031.44 | 3,051.04 | 3,064.97 | 3,084.57 | 3,098.50 | 3,118.10 |
| Fibonacci | 3,030.49 | 3,043.30 | 3,051.22 | 3,064.02 | 3,076.83 | 3,084.75 | 3,097.55 |
| Pivot points | S3 | S2 | S1 | PP | R1 | R2 | R3 |
|---|---|---|---|---|---|---|---|
| Standard | 2,811.92 | 2,878.32 | 2,968.49 | 3,034.89 | 3,125.06 | 3,191.46 | 3,281.63 |
| Camarilla | 3,015.60 | 3,029.96 | 3,044.31 | 3,058.66 | 3,073.01 | 3,087.36 | 3,101.72 |
| Woodie | 2,823.81 | 2,884.26 | 2,980.38 | 3,040.83 | 3,136.95 | 3,197.40 | 3,293.52 |
| Fibonacci | 2,878.32 | 2,938.13 | 2,975.08 | 3,034.89 | 3,094.70 | 3,131.65 | 3,191.46 |
| Pivot points | S3 | S2 | S1 | PP | R1 | R2 | R3 |
|---|---|---|---|---|---|---|---|
| Standard | 2,486.62 | 2,653.67 | 2,876.40 | 3,043.45 | 3,266.18 | 3,433.23 | 3,655.96 |
| Camarilla | 2,991.93 | 3,027.66 | 3,063.39 | 3,099.12 | 3,134.85 | 3,170.58 | 3,206.31 |
| Woodie | 2,514.45 | 2,667.59 | 2,904.23 | 3,057.37 | 3,294.01 | 3,447.15 | 3,683.79 |
| Fibonacci | 2,653.67 | 2,802.57 | 2,894.56 | 3,043.45 | 3,192.35 | 3,284.34 | 3,433.23 |
Numerical data
The following is the status of the technical indicators and moving averages at the time of publication of this technical analysis:
| RSI (14): | 47.81 | |
| MACD (12,26,9): | 1.1900 | |
| Directional Movement: | 1.48 | |
| AROON (14): | 42.86 | |
| DEMA (21): | 3,020.48 | |
| Parabolic SAR (0,02-0,02-0,2): | 3,210.51 | |
| Elder Ray (13): | -19.75 | |
| Super Trend (3,10): | 2,870.58 | |
| Zig ZAG (10): | 2,999.95 | |
| VORTEX (21): | 0.8700 | |
| Stochastique (14,3,5): | 41.37 | |
| TEMA (21): | 3,083.62 | |
| Williams %R (14): | -77.45 | |
| Chande Momentum Oscillator (20): | 57.17 | |
| Repulse (5,40,3): | -1.3000 | |
| ROCnROLL: | 2 | |
| TRIX (15,9): | 0.0200 | |
| Courbe Coppock: | 4.01 |
| MA7: | 3,034.84 | |
| MA20: | 3,017.56 | |
| MA50: | 2,996.72 | |
| MA100: | 3,498.02 | |
| MAexp7: | 3,037.42 | |
| MAexp20: | 3,026.86 | |
| MAexp50: | 3,129.69 | |
| MAexp100: | 3,331.17 | |
| Price / MA7: | -1.18% | |
| Price / MA20: | -0.62% | |
| Price / MA50: | +0.08% | |
| Price / MA100: | -14.27% | |
| Price / MAexp7: | -1.28% | |
| Price / MAexp20: | -0.93% | |
| Price / MAexp50: | -4.19% | |
| Price / MAexp100: | -9.98% |
About author

Online


Add a comment
Comments
0 comments on the analysis BEL20 INDEX - Daily