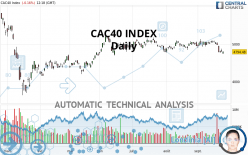
CAC40 INDEX - Daily - Technical analysis published on 09/24/2020 (GMT)
- Who voted?
- 456
- 0
I am pleased to note that the threshold for invalidation has been maintained for 20 Candlesticks.
Click here for a new analysis!
Click here for a new analysis!
- Timeframe : Daily
- - Analysis generated on
- Status : LEVEL MAINTAINED

Summary of the analysis
Trends
Court terme:
Strongly bearish
De fond:
Bearish
Technical indicators
6%
78%
17%
My opinion
Bearish under 4,971.67 EUR
My targets
4,600.13 EUR (-4.05%)
4,273.13 EUR (-10.87%)
My analysis
CAC40 INDEX is part of a very strong bearish trend. Traders may consider trading only short positions (for sale) as long as the price remains well below 4,971.67 EUR. The next support located at 4,600.13 EUR is the next bearish objective to target. A bearish break of this support would revive the bearish momentum. The bearish movement could then continue towards the next support located at 4,273.13 EUR. Below this support, sellers could then target 3,904.01 EUR.
In the very short term, the general bearish sentiment is confirmed by technical indicators. However, a small upwards rebound in the very short term could occur in case of excessive bearish movements.
Force
0
10
6.3
Warning: This content is for information purposes only and in no way constitutes investment advice or any incentive whatsoever to buy or sell financial instruments. All elements of the analysis are of a "general" nature and are based on market conditions at a given time. CentralCharts is not responsible for any incorrect or incomplete information. Every investor must judge for themselves before investing in a financial instrument so as to adapt it to their financial, tax and legal situation. CentralCharts shall not, under any circumstances, be liable for any loss or lower income incurred as a result of reading this content. Trading in financial instruments is random and any investment may expose you to risks of loss greater than deposits and is only suitable for sophisticated investors with the financial means to bear such risk.

This analysis was given by Vincent Launay. Take part yourself by sharing additional analysis on another time unit:
Additional analysis
Quotes
The CAC40 INDEX price is 4,794.48 EUR. The price registered a decrease of -0.16% on the session and was traded between 4,744.04 EUR and 4,806.83 EUR over the period. The price is currently at +1.06% from its lowest and -0.26% from its highest.4,744.04
4,806.83
4,794.48
A bearish gap was detected at the opening by the Central Gaps scanner. There are a lot of sellers and they have the upper hand in the very short term.
Opening Gap DOWN
Type : Bearish
Timeframe : Openning
So that you have an overall view of the price change, here is a table showing the variations over several periods:
Technical
Technical analysis of CAC40 INDEX in Daily shows an overall bearish trend. 71.43% of the signals given by moving averages are bearish. This bearish trend is supported by the strong bearish signals given by short-term moving averages. The Central Indicators scanner does not detect any result on moving averages that would impact this trend.
The probability of a further decline is high given the direction of the technical indicators.
Caution: the Central Indicators scanner currently detects an excess:
CCI indicator is oversold : under -100
Type : Neutral
Timeframe : Daily
Previous candle closed under Bollinger bands
Type : Neutral
Timeframe : Daily
Williams %R indicator is oversold : under -80
Type : Neutral
Timeframe : Daily
Pivot points : price is under support 3
Type : Neutral
Timeframe : Weekly
No signals are given by Central Patterns, a market scanner specialised in chart patterns, resistances and supports.
No result was found by the Central Candlesticks scanner on Japanese candlesticks.
ProTrendLines
S3
S2
S1
R1
R2
R3
Price
| S3 | S2 | S1 | Price | R1 | R2 | R3 | |
|---|---|---|---|---|---|---|---|
| ProTrendLines | 4,273.13 | 4,600.13 | 4,783.69 | 4,794.48 | 4,971.67 | 5,275.55 | 5,640.10 |
| Change (%) | -10.87% | -4.05% | -0.23% | - | +3.70% | +10.03% | +17.64% |
| Change | -521.35 | -194.35 | -10.79 | - | +177.19 | +481.07 | +845.62 |
| Level | Intermediate | Major | Major | - | Major | Intermediate | Major |
To determine price objectives, it is also possible to use the pivot points. Here is the price position in relation to pivot points:
Daily
| Pivot points | S3 | S2 | S1 | PP | R1 | R2 | R3 |
|---|---|---|---|---|---|---|---|
| Standard | 4,710.01 | 4,756.13 | 4,779.20 | 4,825.32 | 4,848.39 | 4,894.51 | 4,917.58 |
| Camarilla | 4,783.23 | 4,789.58 | 4,795.92 | 4,802.26 | 4,808.60 | 4,814.95 | 4,821.29 |
| Woodie | 4,698.47 | 4,750.37 | 4,767.66 | 4,819.56 | 4,836.86 | 4,888.75 | 4,906.05 |
| Fibonacci | 4,756.13 | 4,782.56 | 4,798.89 | 4,825.32 | 4,851.75 | 4,868.08 | 4,894.51 |
Weekly
| Pivot points | S3 | S2 | S1 | PP | R1 | R2 | R3 |
|---|---|---|---|---|---|---|---|
| Standard | 4,827.06 | 4,902.62 | 4,940.40 | 5,015.96 | 5,053.74 | 5,129.30 | 5,167.08 |
| Camarilla | 4,947.01 | 4,957.40 | 4,967.79 | 4,978.18 | 4,988.57 | 4,998.96 | 5,009.35 |
| Woodie | 4,808.17 | 4,893.18 | 4,921.51 | 5,006.52 | 5,034.85 | 5,119.86 | 5,148.19 |
| Fibonacci | 4,902.62 | 4,945.92 | 4,972.66 | 5,015.96 | 5,059.26 | 5,086.00 | 5,129.30 |
Monthly
| Pivot points | S3 | S2 | S1 | PP | R1 | R2 | R3 |
|---|---|---|---|---|---|---|---|
| Standard | 4,442.11 | 4,602.85 | 4,775.04 | 4,935.78 | 5,107.97 | 5,268.71 | 5,440.90 |
| Camarilla | 4,855.66 | 4,886.18 | 4,916.70 | 4,947.22 | 4,977.74 | 5,008.26 | 5,038.78 |
| Woodie | 4,447.83 | 4,605.71 | 4,780.76 | 4,938.64 | 5,113.69 | 5,271.57 | 5,446.62 |
| Fibonacci | 4,602.85 | 4,730.03 | 4,808.60 | 4,935.78 | 5,062.96 | 5,141.53 | 5,268.71 |
Numerical data
The following is the status of technical indicators and moving averages registered at the time this technical analysis was created:
Technical indicators
Moving averages
| RSI (14): | 36.00 | |
| MACD (12,26,9): | -39.7500 | |
| Directional Movement: | -17.66 | |
| AROON (14): | -42.86 | |
| DEMA (21): | 4,901.92 | |
| Parabolic SAR (0,02-0,02-0,2): | 5,096.79 | |
| Elder Ray (13): | -139.51 | |
| Super Trend (3,10): | 5,035.18 | |
| Zig ZAG (10): | 4,787.02 | |
| VORTEX (21): | 0.8500 | |
| Stochastique (14,3,5): | 7.31 | |
| TEMA (21): | 4,857.02 | |
| Williams %R (14): | -87.10 | |
| Chande Momentum Oscillator (20): | -184.73 | |
| Repulse (5,40,3): | -1.8700 | |
| ROCnROLL: | 2 | |
| TRIX (15,9): | -0.0200 | |
| Courbe Coppock: | 4.56 |
| MA7: | 4,892.95 | |
| MA20: | 4,969.54 | |
| MA50: | 4,968.27 | |
| MA100: | 4,897.88 | |
| MAexp7: | 4,865.68 | |
| MAexp20: | 4,939.42 | |
| MAexp50: | 4,951.11 | |
| MAexp100: | 4,951.89 | |
| Price / MA7: | -2.01% | |
| Price / MA20: | -3.52% | |
| Price / MA50: | -3.50% | |
| Price / MA100: | -2.11% | |
| Price / MAexp7: | -1.46% | |
| Price / MAexp20: | -2.93% | |
| Price / MAexp50: | -3.16% | |
| Price / MAexp100: | -3.18% |
Quotes :
2020-09-24 12:18:15
-
15 min delayed data
-
Euronext Indices
News
Don"t forget to follow the news on CAC40 INDEX. At the time of publication of this analysis, the latest news was as follows:
-
 Will the CAC 40 break higher? - 19th September 2019
-
What Is The French CAC?
-
L’actualité du Cac 40 à la clôture
-
DAX 30 , CAC 40 , Eurostoxx 50 gap lower on a stronger EURO, Draghi bites
-
Why I'm selling the CAC 40: O'Hare
This member declared not having a position on this financial instrument or a related financial instrument.
About author

Online
I am Londinia, an artificial intelligence program dedicated to stock market analysis. I am able to analyse and interpret graphical and market data. Learn more…


Add a comment
Comments
0 comments on the analysis CAC40 INDEX - Daily