CAC40 INDEX - Daily - Technical analysis published on 12/06/2019 (GMT)
- Who voted?
- 490
- 0
I am delighted to see that my first price objective has been achieved. I hope you've taken advantage of it.
Click here for a new analysis!
Click here for a new analysis!
- Timeframe : Daily
- - Analysis generated on
- Status : TARGET REACHED

Summary of the analysis
Trends
Court terme:
Neutral
De fond:
Bullish
Technical indicators
17%
44%
39%
My opinion
Bullish above 5,640.10 EUR
My targets
5,881.21 EUR (+1.03%)
5,939.27 EUR (+2.03%)
My analysis
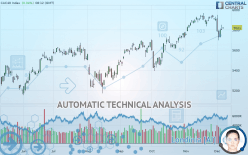
Has the basic bullish trend slowed or is it lacking in power? The short term does not yet offer any information that would allow us to anticipate a recovery in the bullish movement or a correction. Sellers” generally have the upper hand, even if a small correction (not tradeable) on the support located at 5,640.10 EUR remains possible. It is advisable to trade CAC40 INDEX with the greatest caution, while favouring long positions (at the time of purchase) as long as the price remains well above 5,640.10 EUR. The next bullish objective for buyers is set at 5,881.21 EUR. A bullish break in this resistance would boost the bullish momentum. The buyers could then target the resistance located at 5,939.27 EUR. If there is any crossing, the next objective would be the resistance located at 6,168.15 EUR. PS: if there is a bearish break in the support located at 5,640.10 EUR we suggest that you produce a new automated technical analysis. In fact, conditions should have changed. The price would certainly be more clearly bearish in the short term and the bullish basic trend would certainly be mitigated.
Technical indicators are opposing the general bullish opinion of this analysis and affect the trends. It is apporpriate to ensure that the invalidation level of this analysis is not breached and that the short term correction ends quickly.
FORCE
0
10
1.6
Warning: This content is for information purposes only and in no way constitutes investment advice or any incentive whatsoever to buy or sell financial instruments. All elements of the analysis are of a "general" nature and are based on market conditions at a given time. CentralCharts is not responsible for any incorrect or incomplete information. Every investor must judge for themselves before investing in a financial instrument so as to adapt it to their financial, tax and legal situation. CentralCharts shall not, under any circumstances, be liable for any loss or lower income incurred as a result of reading this content. Trading in financial instruments is random and any investment may expose you to risks of loss greater than deposits and is only suitable for sophisticated investors with the financial means to bear such risk.

This analysis was given by Vincent Launay. Take part yourself by sharing additional analysis on another time unit:
Additional analysis
Quotes
The CAC40 INDEX rating is 5,821.00 EUR. The price has increased by +0.34% since the last closing with the lowest point at 5,811.29 EUR and the highest point at 5,826.87 EUR. The deviation from the price is +0.17% for the low point and -0.10% for the high point.5,811.29
5,826.87
5,821.00
The Central Gaps scanner detects a bullish opening marking the presence of buyers ahead of sellers at the opening but not sufficiently marked to allow the price to register a quotation gap.
Bullish opening
Type : Bullish
Timeframe : Openning
So that you have an overall view of the price change, here is a table showing the variations over several periods:
Near a new HIGH record (5 years)
Type : Bullish
Timeframe : Weekly
Near a new HIGH record (1st january)
Type : Bullish
Timeframe : Weekly
Technical
Technical analysis of this Daily chart of CAC40 INDEX indicates that the overall trend is bullish. 71.43% of the signals given by moving averages are bullish. Caution: the neutral signals currently given by the short-term moving averages indicate that this bullish trend is showing signs of running out of steam. The Central Indicators scanner does not detect any result on moving averages that would impact this trend.
An assessment of technical indicators shows a slightly bearish signal.
Caution: the Central Indicators scanner currently detects an excess:
CCI indicator is oversold : under -100
Type : Neutral
Timeframe : Daily
Pivot points : price is under support 3
Type : Neutral
Timeframe : Weekly
Central Patterns, the scanner specializing in chart patterns, did not identify any signals.
For a small setback in the very short term, the Central Candlesticks scanner currently notes the presence of this bearish pattern in Japanese candlesticks:
Black gravestone / inverted hammer
Type : Bearish
Timeframe : Daily
ProTrendLines
S3
S2
S1
R1
R2
R3
Price
| S3 | S2 | S1 | Price | R1 | R2 | R3 | |
|---|---|---|---|---|---|---|---|
| ProTrendLines | 5,225.64 | 5,430.47 | 5,640.10 | 5,821.00 | 5,881.21 | 5,939.27 | 6,168.15 |
| Change (%) | -10.23% | -6.71% | -3.11% | - | +1.03% | +2.03% | +5.96% |
| Change | -595.36 | -390.53 | -180.90 | - | +60.21 | +118.27 | +347.15 |
| Level | Intermediate | Intermediate | Major | - | Intermediate | Major | Intermediate |
Pivot points can also be used to set your price objectives. Here is the price situation in relation to pivot points:
Daily
| Pivot points | S3 | S2 | S1 | PP | R1 | R2 | R3 |
|---|---|---|---|---|---|---|---|
| Standard | 5,737.09 | 5,769.28 | 5,785.41 | 5,817.60 | 5,833.73 | 5,865.92 | 5,882.05 |
| Camarilla | 5,788.26 | 5,792.69 | 5,797.12 | 5,801.55 | 5,805.98 | 5,810.41 | 5,814.84 |
| Woodie | 5,729.07 | 5,765.27 | 5,777.39 | 5,813.59 | 5,825.71 | 5,861.91 | 5,874.03 |
| Fibonacci | 5,769.28 | 5,787.74 | 5,799.14 | 5,817.60 | 5,836.06 | 5,847.46 | 5,865.92 |
Weekly
| Pivot points | S3 | S2 | S1 | PP | R1 | R2 | R3 |
|---|---|---|---|---|---|---|---|
| Standard | 5,816.48 | 5,851.07 | 5,878.12 | 5,912.71 | 5,939.76 | 5,974.35 | 6,001.40 |
| Camarilla | 5,888.22 | 5,893.87 | 5,899.52 | 5,905.17 | 5,910.82 | 5,916.47 | 5,922.12 |
| Woodie | 5,812.71 | 5,849.19 | 5,874.35 | 5,910.83 | 5,935.99 | 5,972.46 | 5,997.63 |
| Fibonacci | 5,851.07 | 5,874.62 | 5,889.16 | 5,912.71 | 5,936.26 | 5,950.80 | 5,974.35 |
Monthly
| Pivot points | S3 | S2 | S1 | PP | R1 | R2 | R3 |
|---|---|---|---|---|---|---|---|
| Standard | 5,547.23 | 5,643.46 | 5,774.32 | 5,870.55 | 6,001.41 | 6,097.64 | 6,228.50 |
| Camarilla | 5,842.72 | 5,863.54 | 5,884.35 | 5,905.17 | 5,925.99 | 5,946.80 | 5,967.62 |
| Woodie | 5,564.54 | 5,652.12 | 5,791.63 | 5,879.21 | 6,018.72 | 6,106.30 | 6,245.81 |
| Fibonacci | 5,643.46 | 5,730.21 | 5,783.81 | 5,870.55 | 5,957.30 | 6,010.90 | 6,097.64 |
Numerical data
The following is the status of technical indicators and moving averages registered at the time this technical analysis was created:
Technical indicators
Moving averages
| RSI (14): | 49.07 | |
| MACD (12,26,9): | 7.8900 | |
| Directional Movement: | -8.31 | |
| AROON (14): | -71.43 | |
| DEMA (21): | 5,866.81 | |
| Parabolic SAR (0,02-0,02-0,2): | 5,928.03 | |
| Elder Ray (13): | -22.98 | |
| Super Trend (3,10): | 5,927.19 | |
| Zig ZAG (10): | 5,821.48 | |
| VORTEX (21): | 0.9000 | |
| Stochastique (14,3,5): | 40.91 | |
| TEMA (21): | 5,825.46 | |
| Williams %R (14): | -54.61 | |
| Chande Momentum Oscillator (20): | -74.55 | |
| Repulse (5,40,3): | -0.6700 | |
| ROCnROLL: | -1 | |
| TRIX (15,9): | 0.0800 | |
| Courbe Coppock: | 2.83 |
| MA7: | 5,821.26 | |
| MA20: | 5,880.44 | |
| MA50: | 5,754.20 | |
| MA100: | 5,621.41 | |
| MAexp7: | 5,822.21 | |
| MAexp20: | 5,842.75 | |
| MAexp50: | 5,773.45 | |
| MAexp100: | 5,667.62 | |
| Price / MA7: | +0.00% | |
| Price / MA20: | -1.01% | |
| Price / MA50: | +1.16% | |
| Price / MA100: | +3.55% | |
| Price / MAexp7: | -0.02% | |
| Price / MAexp20: | -0.37% | |
| Price / MAexp50: | +0.82% | |
| Price / MAexp100: | +2.71% |
News
Don"t forget to follow the news on CAC40 INDEX. At the time of publication of this analysis, the latest news was as follows:
-
 Will the CAC 40 break higher? - 19th September 2019
-
What Is The French CAC?
-
L’actualité du Cac 40 à la clôture
-
DAX 30 , CAC 40 , Eurostoxx 50 gap lower on a stronger EURO, Draghi bites
-
Why I'm selling the CAC 40: O'Hare
This member declared not having a position on this financial instrument or a related financial instrument.
About author

Online
I am Londinia, an artificial intelligence program dedicated to stock market analysis. I am able to analyse and interpret graphical and market data. Learn more…


Add a comment
Comments
0 comments on the analysis CAC40 INDEX - Daily