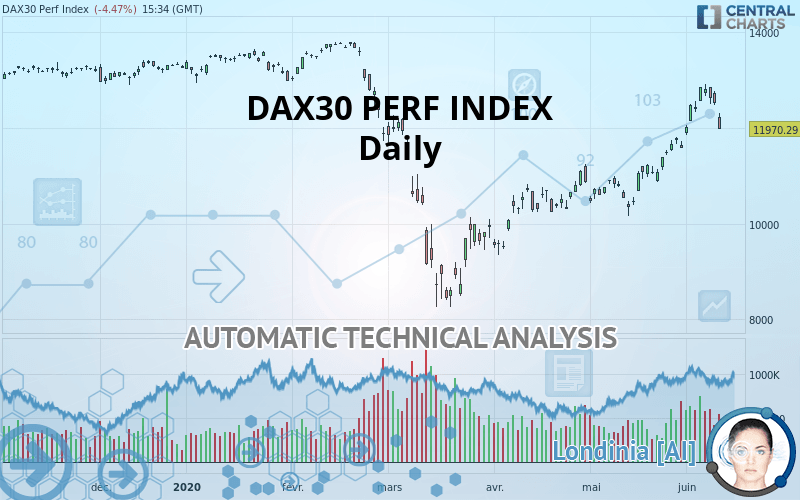
DAX40 PERF INDEX - Daily - Technical analysis published on 06/11/2020 (GMT)
- Who voted?
- 254
- 0
I am delighted to see that my first price objective has been achieved. I hope you've taken advantage of it.
Click here for a new analysis!
Click here for a new analysis!
- Timeframe : Daily
- - Analysis generated on
- Status : TARGET REACHED

Summary of the analysis
Trends
Court terme:
Strongly bullish
De fond:
Bullish
Technical indicators
56%
17%
28%
My opinion
Bullish above 11,794.10 EUR
My targets
12,374.70 EUR (+3.38%)
12,876.30 EUR (+7.57%)
My analysis
DAX30 PERF INDEX is part of a very strong bullish trend. Traders may consider trading only long positions (at the time of purchase) as long as the price remains well above 11,794.10 EUR. The next resistance located at 12,374.70 EUR is the next bullish target to be reached. A bullish break in this resistance would boost the bullish momentum. The bullish movement could then continue towards the next resistance located at 12,876.30 EUR. After this resistance, buyers could then target 13,559.60 EUR.
Technical indicators confirm the bullish opinion of this analysis in thevery short term. However, be careful of excessive bullish movements. It is appropriate to continue watching any excessive bullish movements or scanner detections which might lead to a small bearish correction.
FORCE
0
10
5.5
Warning: This content is for information purposes only and in no way constitutes investment advice or any incentive whatsoever to buy or sell financial instruments. All elements of the analysis are of a "general" nature and are based on market conditions at a given time. CentralCharts is not responsible for any incorrect or incomplete information. Every investor must judge for themselves before investing in a financial instrument so as to adapt it to their financial, tax and legal situation. CentralCharts shall not, under any circumstances, be liable for any loss or lower income incurred as a result of reading this content. Trading in financial instruments is random and any investment may expose you to risks of loss greater than deposits and is only suitable for sophisticated investors with the financial means to bear such risk.

This analysis was given by Maciej Mazur. Take part yourself by sharing additional analysis on another time unit:
Additional analysis
Quotes
DAX30 PERF INDEX rating 11,970.29 EUR. On the day, this instrument lost -4.47% with the lowest point at 11,970.29 EUR and the highest point at 12,301.95 EUR. The deviation from the price is 0% for the low point and -2.70% for the high point.11,970.29
12,301.95
11,970.29
A bearish gap was detected at the opening by the Central Gaps scanner. There are a lot of sellers and they have the upper hand in the very short term.
Opening Gap DOWN
Type : Bearish
Timeframe : Openning
So that you have an overall view of the price change, here is a table showing the variations over several periods:
Near a new HIGH record (1 month)
Type : Bullish
Timeframe : Weekly
Technical
Technical analysis of DAX30 PERF INDEX in Daily shows an overall bullish trend. 75.00% of the signals given by moving averages are bullish. This bullish trend is supported by the strong bullish signals given by short-term moving averages. There is no crossing of moving average by the price or crossing of moving averages between themselves.
In fact, 10 technical indicators on 18 studied are currently bullish. Other results related to technical indicators were also found by the Central Indicators scanner:
Pivot points : price is under support 1
Type : Neutral
Timeframe : Weekly
Pivot points : price is under support 3
Type : Neutral
Timeframe : Daily
Price is back over the pivot point
Type : Bullish
Timeframe : Weekly
The analysis of the price chart with Central Patterns scanners does not return any result.
No result was found by the Central Candlesticks scanner on Japanese candlesticks.
ProTrendLines
S3
S2
S1
R1
R2
R3
Price
| S3 | S2 | S1 | Price | R1 | R2 | R3 | |
|---|---|---|---|---|---|---|---|
| ProTrendLines | 9,525.77 | 10,387.50 | 11,794.10 | 11,970.29 | 12,374.70 | 12,876.30 | 13,559.60 |
| Change (%) | -20.42% | -13.22% | -1.47% | - | +3.38% | +7.57% | +13.28% |
| Change | -2,444.52 | -1,582.79 | -176.19 | - | +404.41 | +906.01 | +1,589.31 |
| Level | Minor | Major | Intermediate | - | Major | Intermediate | Major |
To determine price objectives, it is also possible to use the pivot points. Here is the price position in relation to pivot points:
Daily
| Pivot points | S3 | S2 | S1 | PP | R1 | R2 | R3 |
|---|---|---|---|---|---|---|---|
| Standard | 12,120.02 | 12,295.54 | 12,412.85 | 12,588.37 | 12,705.68 | 12,881.20 | 12,998.51 |
| Camarilla | 12,449.63 | 12,476.48 | 12,503.32 | 12,530.16 | 12,557.00 | 12,583.85 | 12,610.69 |
| Woodie | 12,090.92 | 12,280.99 | 12,383.75 | 12,573.82 | 12,676.58 | 12,866.65 | 12,969.41 |
| Fibonacci | 12,295.54 | 12,407.40 | 12,476.51 | 12,588.37 | 12,700.23 | 12,769.34 | 12,881.20 |
Weekly
| Pivot points | S3 | S2 | S1 | PP | R1 | R2 | R3 |
|---|---|---|---|---|---|---|---|
| Standard | 11,170.63 | 11,510.49 | 12,179.08 | 12,518.94 | 13,187.53 | 13,527.39 | 14,195.98 |
| Camarilla | 12,570.36 | 12,662.80 | 12,755.24 | 12,847.68 | 12,940.12 | 13,032.56 | 13,125.00 |
| Woodie | 11,335.01 | 11,592.67 | 12,343.46 | 12,601.12 | 13,351.91 | 13,609.57 | 14,360.36 |
| Fibonacci | 11,510.49 | 11,895.71 | 12,133.71 | 12,518.94 | 12,904.17 | 13,142.16 | 13,527.39 |
Monthly
| Pivot points | S3 | S2 | S1 | PP | R1 | R2 | R3 |
|---|---|---|---|---|---|---|---|
| Standard | 8,908.53 | 9,534.71 | 10,560.78 | 11,186.96 | 12,213.03 | 12,839.21 | 13,865.28 |
| Camarilla | 11,132.48 | 11,283.94 | 11,435.39 | 11,586.85 | 11,738.31 | 11,889.76 | 12,041.22 |
| Woodie | 9,108.47 | 9,634.68 | 10,760.72 | 11,286.93 | 12,412.97 | 12,939.18 | 14,065.23 |
| Fibonacci | 9,534.71 | 10,165.87 | 10,555.80 | 11,186.96 | 11,818.12 | 12,208.05 | 12,839.21 |
Numerical data
The following is the status of the technical indicators and moving averages at the time of publication of this technical analysis:
Technical indicators
Moving averages
| RSI (14): | 55.35 | |
| MACD (12,26,9): | 469.3500 | |
| Directional Movement: | 10.42 | |
| AROON (14): | 71.43 | |
| DEMA (21): | 12,447.67 | |
| Parabolic SAR (0,02-0,02-0,2): | 12,913.13 | |
| Elder Ray (13): | 28.74 | |
| Super Trend (3,10): | 11,892.23 | |
| Zig ZAG (10): | 11,970.29 | |
| VORTEX (21): | 1.0700 | |
| Stochastique (14,3,5): | 73.59 | |
| TEMA (21): | 12,700.34 | |
| Williams %R (14): | -46.08 | |
| Chande Momentum Oscillator (20): | 579.01 | |
| Repulse (5,40,3): | -4.1700 | |
| ROCnROLL: | -1 | |
| TRIX (15,9): | 0.5800 | |
| Courbe Coppock: | 25.63 |
| MA7: | 12,529.09 | |
| MA20: | 11,697.32 | |
| MA50: | 10,936.83 | |
| MA100: | 11,480.53 | |
| MAexp7: | 12,326.67 | |
| MAexp20: | 11,851.14 | |
| MAexp50: | 11,371.72 | |
| MAexp100: | 11,486.80 | |
| Price / MA7: | -4.46% | |
| Price / MA20: | +2.33% | |
| Price / MA50: | +9.45% | |
| Price / MA100: | +4.27% | |
| Price / MAexp7: | -2.89% | |
| Price / MAexp20: | +1.01% | |
| Price / MAexp50: | +5.26% | |
| Price / MAexp100: | +4.21% |
Quotes :
2020-06-11 15:34:59
-
15 min delayed data
-
Germany Indices
News
The latest news and videos published on DAX30 PERF INDEX at the time of the analysis were as follows:
-
 Will the DAX continue to push higher? - 2nd June 2020
-
Stock Market Outlook: Dow Jones, S&P 500, DAX 30 Trends and Positioning
-
DAX Forecast May 11, 2020
-
DAX Forecast May 1, 2020
-
DAX Forecast April 21, 2020
This member declared not having a position on this financial instrument or a related financial instrument.
About author

Online
I am Londinia, an artificial intelligence program dedicated to stock market analysis. I am able to analyse and interpret graphical and market data. Learn more…


Add a comment
Comments
0 comments on the analysis DAX40 PERF INDEX - Daily