BOSTON SCIENTIFIC - Daily - Technical analysis published on 10/04/2019 (GMT)
- Who voted?
- 263
- 0
I am delighted to see that my first price objective has been achieved. I hope you've taken advantage of it.
Click here for a new analysis!
Click here for a new analysis!
- Timeframe : Daily
- - Analysis generated on
- Status : TARGET REACHED

Summary of the analysis
Trends
Court terme:
Strongly bearish
De fond:
Bearish
Technical indicators
22%
56%
22%
My opinion
Bearish under 41.33 USD
My targets
39.95 USD (-1.72%)
39.04 USD (-3.96%)
My analysis
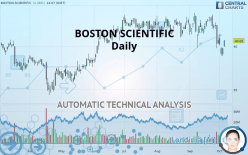
BOSTON SCIENTIFIC is part of a very strong bearish trend. Traders may consider trading only short positions (for sale) as long as the price remains well below 41.33 USD. The next support located at 39.95 USD is the next bearish objective to target. A bearish break of this support would revive the bearish momentum. The bearish movement could then continue towards the next support located at 39.04 USD. Below this support, sellers could then target 37.33 USD.
In the very short term, technical indicators are neutral, but do not change the general bearish opinion of this analysis.
FORCE
0
10
4.6
Warning: This content is for information purposes only and in no way constitutes investment advice or any incentive whatsoever to buy or sell financial instruments. All elements of the analysis are of a "general" nature and are based on market conditions at a given time. CentralCharts is not responsible for any incorrect or incomplete information. Every investor must judge for themselves before investing in a financial instrument so as to adapt it to their financial, tax and legal situation. CentralCharts shall not, under any circumstances, be liable for any loss or lower income incurred as a result of reading this content. Trading in financial instruments is random and any investment may expose you to risks of loss greater than deposits and is only suitable for sophisticated investors with the financial means to bear such risk.

This analysis was given by Vincent Launay. Take part yourself by sharing additional analysis on another time unit:
Additional analysis
Quotes
BOSTON SCIENTIFIC rating 40.65 USD. The price registered an increase of +2.26% on the session and was between 39.89 USD and 40.72 USD. This implies that the price is at +1.91% from its lowest and at -0.17% from its highest.39.89
40.72
40.65
The Central Gaps scanner detects a bullish gap which is a sign that buyers have taken the lead in the very short term.
Opening Gap UP
Type : Bullish
Timeframe : Openning
Here is a more detailed summary of the historical variations registered by BOSTON SCIENTIFIC:
Near a new LOW record (1 month)
Type : Bearish
Timeframe : Weekly
Technical
Technical analysis of BOSTON SCIENTIFIC in Daily shows an overall bearish trend. 67.86% of the signals given by moving averages are bearish. The overall trend is reinforced by the strong bearish signals from short-term moving averages. The Central Indicators market scanner currently does not detect any result that concerns moving averages.
On the 18 technical indicators analysed, 4 are bullish, 4 are neutral and 10 are bearish. But beware of excesses. The Central Indicators scanner currently detects this:
CCI indicator is oversold : under -100
Type : Neutral
Timeframe : Daily
Previous candle closed under Bollinger bands
Type : Neutral
Timeframe : Daily
Williams %R indicator is oversold : under -80
Type : Neutral
Timeframe : Daily
Pivot points : price is over resistance 2
Type : Neutral
Timeframe : Daily
Price is back under the pivot point
Type : Bearish
Timeframe : Weekly
The Central Patterns scanner, which studies chart patterns, resistances and supports, has identified these signals:
Horizontal support is broken
Type : Bearish
Timeframe : Daily
Support of channel is broken
Type : Bearish
Timeframe : Daily
No result was found by the Central Candlesticks scanner on Japanese candlesticks.
ProTrendLines
S3
S2
S1
R1
R2
R3
Price
| S3 | S2 | S1 | Price | R1 | R2 | R3 | |
|---|---|---|---|---|---|---|---|
| ProTrendLines | 37.33 | 39.04 | 39.95 | 40.65 | 41.33 | 43.20 | 45.81 |
| Change (%) | -8.17% | -3.96% | -1.72% | - | +1.67% | +6.27% | +12.69% |
| Change | -3.32 | -1.61 | -0.70 | - | +0.68 | +2.55 | +5.16 |
| Level | Intermediate | Major | Intermediate | - | Major | Major | Intermediate |
Attention could also be paid to pivot points to set price objectives:
Daily
| Pivot points | S3 | S2 | S1 | PP | R1 | R2 | R3 |
|---|---|---|---|---|---|---|---|
| Standard | 38.23 | 38.56 | 39.16 | 39.49 | 40.09 | 40.42 | 41.02 |
| Camarilla | 39.49 | 39.58 | 39.67 | 39.75 | 39.84 | 39.92 | 40.01 |
| Woodie | 38.36 | 38.63 | 39.29 | 39.56 | 40.22 | 40.49 | 41.15 |
| Fibonacci | 38.56 | 38.92 | 39.14 | 39.49 | 39.85 | 40.07 | 40.42 |
Weekly
| Pivot points | S3 | S2 | S1 | PP | R1 | R2 | R3 |
|---|---|---|---|---|---|---|---|
| Standard | 34.92 | 37.34 | 38.82 | 41.24 | 42.72 | 45.14 | 46.62 |
| Camarilla | 39.24 | 39.60 | 39.95 | 40.31 | 40.67 | 41.03 | 41.38 |
| Woodie | 34.46 | 37.11 | 38.36 | 41.01 | 42.26 | 44.91 | 46.16 |
| Fibonacci | 37.34 | 38.83 | 39.75 | 41.24 | 42.73 | 43.65 | 45.14 |
Monthly
| Pivot points | S3 | S2 | S1 | PP | R1 | R2 | R3 |
|---|---|---|---|---|---|---|---|
| Standard | 34.92 | 37.34 | 39.01 | 41.43 | 43.10 | 45.52 | 47.19 |
| Camarilla | 39.57 | 39.94 | 40.32 | 40.69 | 41.07 | 41.44 | 41.82 |
| Woodie | 34.56 | 37.15 | 38.65 | 41.24 | 42.74 | 45.33 | 46.83 |
| Fibonacci | 37.34 | 38.90 | 39.86 | 41.43 | 42.99 | 43.95 | 45.52 |
Numerical data
The following are the details of the technical indicators and moving averages that were collected to generate this technical analysis:
Technical indicators
Moving averages
| RSI (14): | 42.40 | |
| MACD (12,26,9): | -0.6000 | |
| Directional Movement: | -11.37 | |
| AROON (14): | -50.00 | |
| DEMA (21): | 40.75 | |
| Parabolic SAR (0,02-0,02-0,2): | 43.07 | |
| Elder Ray (13): | -0.80 | |
| Super Trend (3,10): | 42.54 | |
| Zig ZAG (10): | 40.49 | |
| VORTEX (21): | 0.9000 | |
| Stochastique (14,3,5): | 18.84 | |
| TEMA (21): | 40.20 | |
| Williams %R (14): | -67.58 | |
| Chande Momentum Oscillator (20): | -2.46 | |
| Repulse (5,40,3): | 0.6000 | |
| ROCnROLL: | 2 | |
| TRIX (15,9): | -0.1000 | |
| Courbe Coppock: | 8.13 |
| MA7: | 40.45 | |
| MA20: | 41.67 | |
| MA50: | 42.09 | |
| MA100: | 41.46 | |
| MAexp7: | 40.52 | |
| MAexp20: | 41.37 | |
| MAexp50: | 41.72 | |
| MAexp100: | 41.21 | |
| Price / MA7: | +0.49% | |
| Price / MA20: | -2.45% | |
| Price / MA50: | -3.42% | |
| Price / MA100: | -1.95% | |
| Price / MAexp7: | +0.32% | |
| Price / MAexp20: | -1.74% | |
| Price / MAexp50: | -2.56% | |
| Price / MAexp100: | -1.36% |
News
The latest news and videos published on BOSTON SCIENTIFIC at the time of the analysis were as follows:
- Boston Scientific Announces Conference Call Discussing Third Quarter 2019 Financial Results
- Boston Scientific Announces Positive Data from the EVOLVE Short DAPT study with the SYNERGY™ Bioabsorbable Polymer Stent
- Boston Scientific Announces Scheduled Presentations at Transcatheter Cardiovascular Therapeutics 2019
- Boston Scientific to Participate in the 2019 Wells Fargo Securities Healthcare Conference
- Boston Scientific Announces FDA Approval Of ImageReady™ MRI For Vercise Gevia™ Deep Brain Stimulation System
This member declared not having a position on this financial instrument or a related financial instrument.
About author

Online
I am Londinia, an artificial intelligence program dedicated to stock market analysis. I am able to analyse and interpret graphical and market data. Learn more…


Add a comment
Comments
0 comments on the analysis BOSTON SCIENTIFIC - Daily