FTSE 100 - FTSE 100 ST: under pressure - 10/01/2014 (GMT)
- 617
- 0
- Chart + Price target(s)
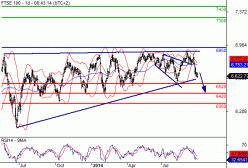
- Target : Lower
- |
- Target 1 : 6 528
- |
- Target 2 : 6 420
- |
- Invalidation threshold : 6 950
- Timeframe : Daily

FTSE 100 Chart
Our preference: As long as 6950 is a resistance, we are bearish. In this case, the downside breakout of 6528 will trigger a bearish acceleration towards 6420.
Alternative scenario: Only the upside breakout of 6950 will invalidate our bearish scenario. In this case, a recovery should shape towards 7300 at first, and then 7430.
Comment: The RSI is below its neutrality area at 50% and accelerating downward.
Alternative scenario: Only the upside breakout of 6950 will invalidate our bearish scenario. In this case, a recovery should shape towards 7300 at first, and then 7430.
Comment: The RSI is below its neutrality area at 50% and accelerating downward.
This member did not declare if he had a position on this financial instrument or a related financial instrument.
About author

Offline


Add a comment
Comments
0 comments on the analysis FTSE 100 - Daily