FTSE 100 - Rebounded on the Uptrend Line - 03/29/2017 (GMT)
- Who voted?
- 754
- 0
- Timeframe : Daily
FTSE 100 Chart
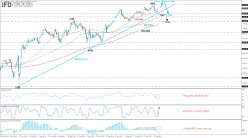
After hitting a new all-time high at 7445 on March 16th, the FTSE 100 index has weakened in the previous week and met the ascending trend line at 7260 which stands over the last nine months. However, the rebound on the aforementioned diagonal line pushed the price higher and made an impressive recovery and now the attention is turning to Brexit negotiations. In addition, the index added more than 7% at its value since December 2016 and our expectation is a further upside movement, recording a new high if there is no significant impact from the referred main event. On the other side, if there is a break below the 7260 support barrier, it would open the way for the 7190 level which overlaps with the 100-daily SMA or moreover until the 7100 key level.
On the daily timeframe, the technical indicators seem to be in contrast. The RSI indicator bounced off the negative territory and jumped above the 50 level while the stochastic oscillator is trading higher with strong momentum. The MACD oscillator is endorsing the bearish scenario as it is falling and is moving with some weak momentum near the neutral area.
On the daily timeframe, the technical indicators seem to be in contrast. The RSI indicator bounced off the negative territory and jumped above the 50 level while the stochastic oscillator is trading higher with strong momentum. The MACD oscillator is endorsing the bearish scenario as it is falling and is moving with some weak momentum near the neutral area.
This member did not declare if he had a position on this financial instrument or a related financial instrument.


Add a comment
Comments
0 comments on the analysis FTSE 100 - Daily