FTSE 100 - Is Trading Sideways in the Short-Term Chart - 10/16/2017 (GMT)
- Who voted?
- 1094
- 0
- Timeframe : 4H
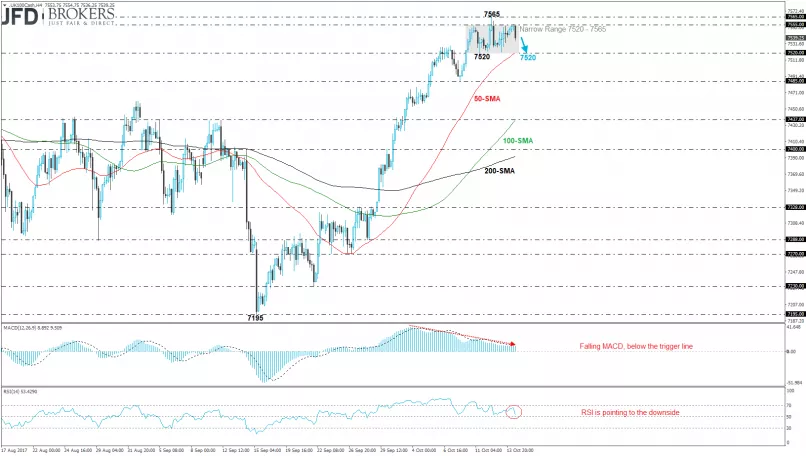
FTSE 100 Chart
The FTSE 100 index is developing in a trading range over the last six days with low at 7520 support level and high at 7555 resistance barrier. The U.K. index currently is plunging and is approaching again the lower boundary, which coincides with the 50-SMA on the 4-hour chart. It is important to refer that the price completed the fourth positive week in a row and climbed more than 4%.
From the technical point of view, on the short-term chart, the MACD oscillator is falling in the positive area and the RSI indicator is dropping sharply in the bullish territory. In addition, on the daily timeframe, the indicators are endorsing the bearish scenario as they are pointing to the south.
From the technical point of view, on the short-term chart, the MACD oscillator is falling in the positive area and the RSI indicator is dropping sharply in the bullish territory. In addition, on the daily timeframe, the indicators are endorsing the bearish scenario as they are pointing to the south.
This member declared not having a position on this financial instrument or a related financial instrument.
About author

Offline


Add a comment
Comments
0 comments on the analysis FTSE 100 - 4H