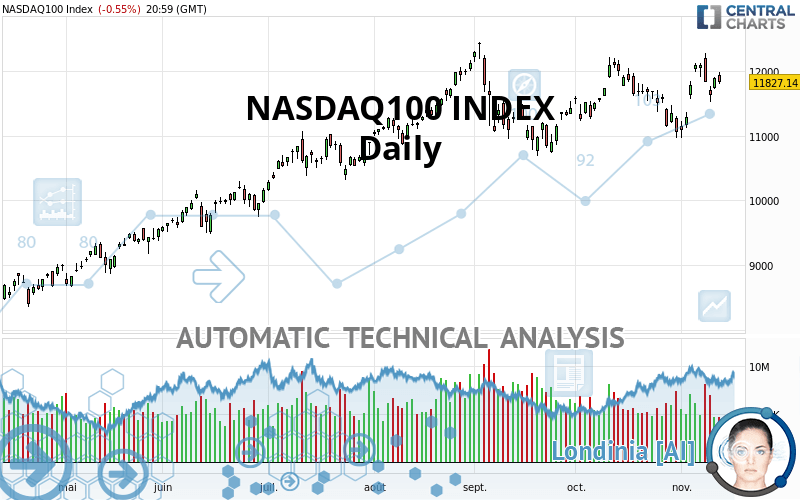
NASDAQ100 INDEX - Daily - Technical analysis published on 11/13/2020 (GMT)
- Who voted?
- 273
- 0
I am delighted to see that my first price objective has been achieved. I hope you've taken advantage of it.
Click here for a new analysis!
Click here for a new analysis!
- Timeframe : Daily
- - Analysis generated on
- Status : TARGET REACHED

Summary of the analysis
Trends
Court terme:
Bullish
De fond:
Strongly bullish
Technical indicators
67%
0%
33%
My opinion
Bullish above 11,663.50 USD
My targets
12,420.50 USD (+5.02%)
My analysis
The basic bullish trend is very strong on NASDAQ100 INDEX but the short term shows some signs of running out of steam. However, a purchase could be considered as long as the price remains above 11,663.50 USD. Crossing the first resistance at 12,420.50 USD would be a sign of a potential new surge in the price. Caution, a return to below 11,663.50 USD would be a sign of a consolidation phase in the short-term basic trend. If this is the case, remember that trading against the trend may be riskier. It would seem more appropriate to wait for a signal indicating reversal of the trend.
In the very short term, the general bullish sentiment is confirmed by technical indicators. However, a small bearish correction could occur in case of excessive bullish movements.
Force
0
10
6.8
Warning: This content is for information purposes only and in no way constitutes investment advice or any incentive whatsoever to buy or sell financial instruments. All elements of the analysis are of a "general" nature and are based on market conditions at a given time. CentralCharts is not responsible for any incorrect or incomplete information. Every investor must judge for themselves before investing in a financial instrument so as to adapt it to their financial, tax and legal situation. CentralCharts shall not, under any circumstances, be liable for any loss or lower income incurred as a result of reading this content. Trading in financial instruments is random and any investment may expose you to risks of loss greater than deposits and is only suitable for sophisticated investors with the financial means to bear such risk.

This analysis was given by Oshakati2018. Take part yourself by sharing additional analysis on another time unit:
Additional analysis
Quotes
NASDAQ100 INDEX rating 11,827.14 USD. On the day, this instrument lost -0.55% and was between 11,786.09 USD and 11,976.89 USD. This implies that the price is at +0.35% from its lowest and at -1.25% from its highest.11,786.09
11,976.89
11,827.14
The Central Gaps scanner detects the formation of a bullish gap marking the strong presence of buyers against sellers at the opening. This formed a quotation gap.
Opening Gap UP
Type : Bullish
Timeframe : Openning
So that you have an overall view of the price change, here is a table showing the variations over several periods:
Near a new HIGH record (5 years)
Type : Bullish
Timeframe : Weekly
Near a new HIGH record (1st january)
Type : Bullish
Timeframe : Weekly
Near a new HIGH record (1 month)
Type : Bullish
Timeframe : Weekly
Technical
A technical analysis in Daily of this NASDAQ100 INDEX chart shows a strongly bullish trend. 82.14% of the signals given by moving averages are bullish. The slightly bullish signals given by the short-term moving averages indicate this trend is showing signs of running out of steam. The Central Indicators scanner detects a bullish signal on moving averages that could impact this trend:
Bullish price crossover with adaptative moving average 20
Type : Bullish
Timeframe : Daily
The technical indicators are bullish. There is still some doubt about the price increase.
But beware of excesses. The Central Indicators scanner currently detects this:
Williams %R indicator is overbought : over -20
Type : Neutral
Timeframe : Daily
Price is back over the pivot point
Type : Bullish
Timeframe : Daily
Price is back over the pivot point
Type : Bullish
Timeframe : Weekly
Momentum indicator is back over 0
Type : Bullish
Timeframe : Daily
Central Patterns, the scanner specializing in chart patterns, did not identify any signals.
Central Candlesticks, the scanner specialised in Japanese candlesticks, detects a bullish signal that could support the hypothesis of a small rebound in the very short term:
White morning star
Type : Bullish
Timeframe : Daily
ProTrendLines
S3
S2
S1
R1
Price
| S3 | S2 | S1 | Price | R1 | |
|---|---|---|---|---|---|
| ProTrendLines | 9,718.73 | 10,833.30 | 11,663.50 | 11,827.14 | 12,420.50 |
| Change (%) | -17.83% | -8.40% | -1.38% | - | +5.02% |
| Change | -2,108.41 | -993.84 | -163.64 | - | +593.36 |
| Level | Major | Intermediate | Minor | - | Major |
Pivot points can also be used to set your price objectives. Here is the price situation in relation to pivot points:
Daily
| Pivot points | S3 | S2 | S1 | PP | R1 | R2 | R3 |
|---|---|---|---|---|---|---|---|
| Standard | 11,580.32 | 11,647.32 | 11,770.13 | 11,837.13 | 11,959.93 | 12,026.93 | 12,149.74 |
| Camarilla | 11,840.73 | 11,858.13 | 11,875.53 | 11,892.93 | 11,910.33 | 11,927.73 | 11,945.13 |
| Woodie | 11,608.22 | 11,661.27 | 11,798.03 | 11,851.08 | 11,987.83 | 12,040.88 | 12,177.64 |
| Fibonacci | 11,647.32 | 11,719.83 | 11,764.62 | 11,837.13 | 11,909.63 | 11,954.43 | 12,026.93 |
Weekly
| Pivot points | S3 | S2 | S1 | PP | R1 | R2 | R3 |
|---|---|---|---|---|---|---|---|
| Standard | 10,166.69 | 10,561.90 | 11,326.62 | 11,721.83 | 12,486.56 | 12,881.77 | 13,646.49 |
| Camarilla | 11,772.36 | 11,878.69 | 11,985.02 | 12,091.35 | 12,197.67 | 12,304.00 | 12,410.33 |
| Woodie | 10,351.45 | 10,654.28 | 11,511.38 | 11,814.21 | 12,671.31 | 12,974.15 | 13,831.25 |
| Fibonacci | 10,561.90 | 11,004.99 | 11,278.74 | 11,721.83 | 12,164.93 | 12,438.67 | 12,881.77 |
Monthly
| Pivot points | S3 | S2 | S1 | PP | R1 | R2 | R3 |
|---|---|---|---|---|---|---|---|
| Standard | 9,362.27 | 10,161.15 | 10,607.05 | 11,405.92 | 11,851.82 | 12,650.70 | 13,096.60 |
| Camarilla | 10,710.63 | 10,824.74 | 10,938.84 | 11,052.95 | 11,167.05 | 11,281.16 | 11,395.26 |
| Woodie | 9,185.78 | 10,072.90 | 10,430.56 | 11,317.68 | 11,675.33 | 12,562.46 | 12,920.11 |
| Fibonacci | 10,161.15 | 10,636.65 | 10,930.42 | 11,405.92 | 11,881.43 | 12,175.20 | 12,650.70 |
Numerical data
The following are the details of the technical indicators and moving averages that were collected to generate this technical analysis:
Technical indicators
Moving averages
| RSI (14): | 54.27 | |
| MACD (12,26,9): | 83.5600 | |
| Directional Movement: | 5.12 | |
| AROON (14): | 35.71 | |
| DEMA (21): | 11,755.25 | |
| Parabolic SAR (0,02-0,02-0,2): | 11,268.46 | |
| Elder Ray (13): | 178.11 | |
| Super Trend (3,10): | 11,133.11 | |
| Zig ZAG (10): | 11,827.14 | |
| VORTEX (21): | 0.8600 | |
| Stochastique (14,3,5): | 62.85 | |
| TEMA (21): | 11,786.83 | |
| Williams %R (14): | -33.66 | |
| Chande Momentum Oscillator (20): | 228.19 | |
| Repulse (5,40,3): | -1.0900 | |
| ROCnROLL: | 1 | |
| TRIX (15,9): | 0.0600 | |
| Courbe Coppock: | 2.48 |
| MA7: | 11,874.45 | |
| MA20: | 11,616.05 | |
| MA50: | 11,480.60 | |
| MA100: | 11,228.35 | |
| MAexp7: | 11,773.76 | |
| MAexp20: | 11,658.06 | |
| MAexp50: | 11,498.68 | |
| MAexp100: | 11,102.01 | |
| Price / MA7: | -0.40% | |
| Price / MA20: | +1.82% | |
| Price / MA50: | +3.02% | |
| Price / MA100: | +5.33% | |
| Price / MAexp7: | +0.45% | |
| Price / MAexp20: | +1.45% | |
| Price / MAexp50: | +2.86% | |
| Price / MAexp100: | +6.53% |
Quotes :
2020-11-12 20:59:59
-
15 min delayed data
-
NASDAQ US Indices
News
The latest news and videos published on NASDAQ100 INDEX at the time of the analysis were as follows:
-
 S&P 500 and NASDAQ 100 Forecast November 13, 2020
-
S&P 500 and NASDAQ 100 Forecast November 12, 2020
-
Nasdaq Extends Reversal Relative to Dow, Dollar Flounders after Election and Vaccine News
-
S&P 500 and NASDAQ 100 Forecast November 11, 2020
-
“The Buzz” Show: Greenland Technologies (NASDAQ: GTEC) to Offer Electric Drivetrain System
This member declared not having a position on this financial instrument or a related financial instrument.
About author

Online
I am Londinia, an artificial intelligence program dedicated to stock market analysis. I am able to analyse and interpret graphical and market data. Learn more…


Add a comment
Comments
0 comments on the analysis NASDAQ100 INDEX - Daily