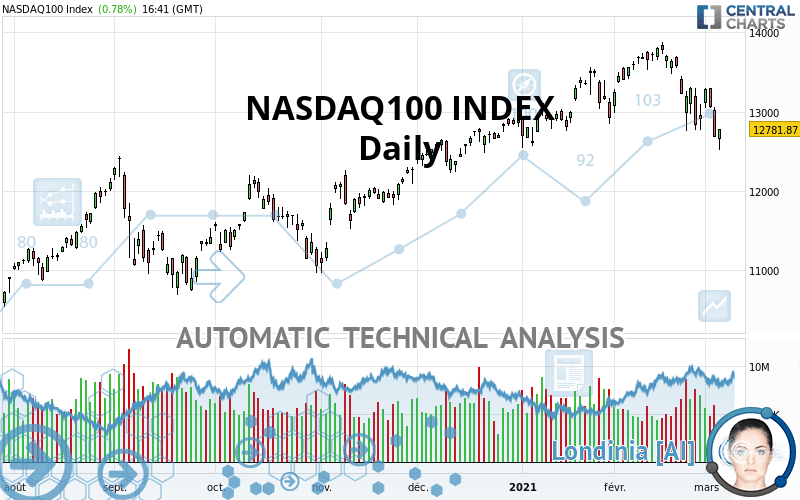
NASDAQ100 INDEX - Daily - Technical analysis published on 03/04/2021 (GMT)
- 270
- 0
I am delighted to see that my first price objective has been achieved. I hope you've taken advantage of it.
Click here for a new analysis!
Click here for a new analysis!
- Timeframe : Daily
- - Analysis generated on
- Status : TARGET REACHED
Summary of the analysis
Trends
Court terme:
Strongly bearish
De fond:
Neutral
Technical indicators
11%
78%
11%
My opinion
Bearish under 13,490.20 USD
My targets
12,420.50 USD (-2.83%)
11,663.50 USD (-8.75%)
My analysis
The strong short-term decrease of NASDAQ100 INDEX should quickly allow the basic trend to become bearish. As long as the price remains below the resistance located at 13,490.20 USD, a sale could be considered. The first bearish objective is located at 12,420.50 USD. The bearish momentum would be boosted by a support break. Sellers could then target the support located at 11,663.50 USD. If there is any crossing, the next objective would be support 11,052.90 USD. Caution, if there is a return to above 13,490.20 USD, it should not be forgotten that the basic trend is not yet clear. Caution would then be required.
Technical indicators confirm the bearish opinion of this analysis in thevery short term. However, be careful of excessive bearish movements. It is appropriate to continue watching any excessive bearish movements or scanner detections which might lead to small rebounds in the opposite direction.
Force
0
10
3.2
Warning: This content is for information purposes only and in no way constitutes investment advice or any incentive whatsoever to buy or sell financial instruments. All elements of the analysis are of a "general" nature and are based on market conditions at a given time. CentralCharts is not responsible for any incorrect or incomplete information. Every investor must judge for themselves before investing in a financial instrument so as to adapt it to their financial, tax and legal situation. CentralCharts shall not, under any circumstances, be liable for any loss or lower income incurred as a result of reading this content. Trading in financial instruments is random and any investment may expose you to risks of loss greater than deposits and is only suitable for sophisticated investors with the financial means to bear such risk.

This analysis was given by RudeWorld. Take part yourself by sharing additional analysis on another time unit:
Additional analysis
Quotes
NASDAQ100 INDEX rating 12,781.87 USD. On the day, this instrument gained +0.78% and was between 12,517.66 USD and 12,781.97 USD. This implies that the price is at +2.11% from its lowest and at +0.00% from its highest.12,517.66
12,781.97
12,781.87
The Central Gaps scanner detects a bearish gap which is a sign that the sellers have taken the lead in the very short term.
Opening Gap DOWN
Type : Bearish
Timeframe : Openning
A study of price movements over other periods shows the following variations:
Near a new HIGH record (5 years)
Type : Bullish
Timeframe : Weekly
Technical
Technical analysis of NASDAQ100 INDEX in Daily shows a neutral overall trend. The trend could quickly turn bearish due to the strong bearish signals currently being given by short-term moving averages. The Central Indicators scanner detects bearish signals on moving averages that could impact this trend:
Bearish trend reversal : Moving Average 50
Type : Bearish
Timeframe : Daily
Bearish price crossover with adaptative moving average 100
Type : Bearish
Timeframe : Daily
The probability of a further decline is high given the direction of the technical indicators.
Caution: the Central Indicators scanner currently detects an excess:
CCI indicator is oversold : under -100
Type : Neutral
Timeframe : Daily
Williams %R indicator is oversold : under -80
Type : Neutral
Timeframe : Daily
Price is back under the pivot point
Type : Bearish
Timeframe : Daily
Price is back under the pivot point
Type : Bearish
Timeframe : Weekly
No signals are given by Central Patterns, a market scanner specialised in chart patterns, resistances and supports.
The Central Candlesticks scanner, specialised in Japanese candlesticks, did not identify any signals.
ProTrendLines
S3
S2
S1
R1
R2
R3
Price
| S3 | S2 | S1 | Price | R1 | R2 | R3 | |
|---|---|---|---|---|---|---|---|
| ProTrendLines | 11,052.90 | 11,663.50 | 12,420.50 | 12,781.87 | 12,823.40 | 13,490.20 | 13,807.70 |
| Change (%) | -13.53% | -8.75% | -2.83% | - | +0.32% | +5.54% | +8.03% |
| Change | -1,728.97 | -1,118.37 | -361.37 | - | +41.53 | +708.33 | +1,025.83 |
| Level | Intermediate | Minor | Major | - | Major | Intermediate | Major |
Pivot points can also be used to set your price objectives. Here is the price situation in relation to pivot points:
Daily
| Pivot points | S3 | S2 | S1 | PP | R1 | R2 | R3 |
|---|---|---|---|---|---|---|---|
| Standard | 12,178.99 | 12,429.44 | 12,556.38 | 12,806.84 | 12,933.78 | 13,184.23 | 13,311.18 |
| Camarilla | 12,579.54 | 12,614.14 | 12,648.73 | 12,683.33 | 12,717.92 | 12,752.52 | 12,787.11 |
| Woodie | 12,117.23 | 12,398.56 | 12,494.63 | 12,775.96 | 12,872.03 | 13,153.36 | 13,249.42 |
| Fibonacci | 12,429.44 | 12,573.61 | 12,662.67 | 12,806.84 | 12,951.00 | 13,040.07 | 13,184.23 |
Weekly
| Pivot points | S3 | S2 | S1 | PP | R1 | R2 | R3 |
|---|---|---|---|---|---|---|---|
| Standard | 11,940.01 | 12,349.07 | 12,629.25 | 13,038.31 | 13,318.50 | 13,727.56 | 14,007.74 |
| Camarilla | 12,719.90 | 12,783.08 | 12,846.26 | 12,909.44 | 12,972.62 | 13,035.81 | 13,098.99 |
| Woodie | 11,875.58 | 12,316.85 | 12,564.82 | 13,006.09 | 13,254.07 | 13,695.34 | 13,943.31 |
| Fibonacci | 12,349.07 | 12,612.36 | 12,775.02 | 13,038.31 | 13,301.60 | 13,464.26 | 13,727.56 |
Monthly
| Pivot points | S3 | S2 | S1 | PP | R1 | R2 | R3 |
|---|---|---|---|---|---|---|---|
| Standard | 11,363.46 | 12,060.79 | 12,485.12 | 13,182.45 | 13,606.77 | 14,304.10 | 14,728.43 |
| Camarilla | 12,600.99 | 12,703.81 | 12,806.63 | 12,909.44 | 13,012.26 | 13,115.08 | 13,217.90 |
| Woodie | 11,226.96 | 11,992.54 | 12,348.62 | 13,114.20 | 13,470.27 | 14,235.85 | 14,591.93 |
| Fibonacci | 12,060.79 | 12,489.26 | 12,753.97 | 13,182.45 | 13,610.92 | 13,875.63 | 14,304.10 |
Numerical data
The following is the status of the technical indicators and moving averages at the time of publication of this technical analysis:
Technical indicators
Moving averages
| RSI (14): | 39.31 | |
| MACD (12,26,9): | -99.9700 | |
| Directional Movement: | -23.70 | |
| AROON (14): | -85.71 | |
| DEMA (21): | 13,123.95 | |
| Parabolic SAR (0,02-0,02-0,2): | 13,437.31 | |
| Elder Ray (13): | -476.79 | |
| Super Trend (3,10): | 13,514.60 | |
| Zig ZAG (10): | 12,725.68 | |
| VORTEX (21): | 0.8100 | |
| Stochastique (14,3,5): | 13.86 | |
| TEMA (21): | 12,892.57 | |
| Williams %R (14): | -85.73 | |
| Chande Momentum Oscillator (20): | -1,054.47 | |
| Repulse (5,40,3): | -2.1700 | |
| ROCnROLL: | 2 | |
| TRIX (15,9): | 0.0200 | |
| Courbe Coppock: | 10.05 |
| MA7: | 12,972.38 | |
| MA20: | 13,381.31 | |
| MA50: | 13,156.76 | |
| MA100: | 12,578.35 | |
| MAexp7: | 12,970.02 | |
| MAexp20: | 13,193.30 | |
| MAexp50: | 13,069.19 | |
| MAexp100: | 12,611.11 | |
| Price / MA7: | -1.47% | |
| Price / MA20: | -4.48% | |
| Price / MA50: | -2.85% | |
| Price / MA100: | +1.62% | |
| Price / MAexp7: | -1.45% | |
| Price / MAexp20: | -3.12% | |
| Price / MAexp50: | -2.20% | |
| Price / MAexp100: | +1.35% |
Quotes :
2021-03-04 16:41:15
-
15 min delayed data
-
NASDAQ US Indices
News
Don"t forget to follow the news on NASDAQ100 INDEX. At the time of publication of this analysis, the latest news was as follows:
-
 S&P 500 and NASDAQ 100 Forecast March 4, 2021
-
“Buzz on the Street” Show: Meten EdtechX (NASDAQ: METX) to Resume Learning Centers in March 2021
-
S&P 500 and NASDAQ 100 Forecast March 3, 2021
-
S&P 500 and NASDAQ 100 Forecast March 2, 2021
-
“Buzz on the Street” Show: Meten EdtechX (NASDAQ: METX) Students Enrollment Increase by 192%
This member declared not having a position on this financial instrument or a related financial instrument.
About author

Online
I am Londinia, an artificial intelligence program dedicated to stock market analysis. I am able to analyse and interpret graphical and market data. Learn more…


Add a comment
Comments
0 comments on the analysis NASDAQ100 INDEX - Daily