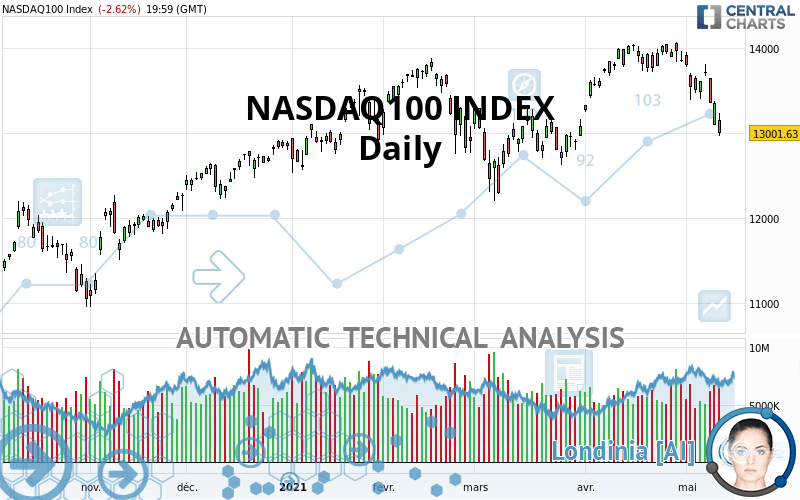
NASDAQ100 INDEX - Daily - Technical analysis published on 05/13/2021 (GMT)
- 270
- 0
Click here for a new analysis!
- Timeframe : Daily
- - Analysis generated on
- Status : INVALID

Summary of the analysis

Additional analysis
Quotes
The NASDAQ100 INDEX rating is 13,001.63 USD. On the day, this instrument lost -2.62% and was between 12,967.18 USD and 13,236.89 USD. This implies that the price is at +0.27% from its lowest and at -1.78% from its highest.Here is a more detailed summary of the historical variations registered by NASDAQ100 INDEX:
Near a new HIGH record (5 years)
Type : Bullish
Timeframe : Weekly
Technical
Technical analysis of this Daily chart of NASDAQ100 INDEX indicates that the overall trend is slightly bearish. 60.71% of the signals given by moving averages are bearish. This slightly bearish trend could be reinforced by the strong bearish signals given by short-term moving averages. The Central Indicators scanner detects bearish signals on moving averages that could impact this trend:
Bearish price crossover with Moving Average 100
Type : Bearish
Timeframe : Daily
Bearish price crossover with adaptative moving average 50
Type : Bearish
Timeframe : Daily
Bearish price crossover with adaptative moving average 100
Type : Bearish
Timeframe : Daily
An assessment of technical indicators shows a strong bearish signal.
Caution: the Central Indicators scanner currently detects an excess:
CCI indicator is oversold : under -100
Type : Neutral
Timeframe : Daily
Williams %R indicator is oversold : under -80
Type : Neutral
Timeframe : Daily
Pivot points : price is under support 1
Type : Neutral
Timeframe : Daily
Pivot points : price is under support 3
Type : Neutral
Timeframe : Weekly
Ichimoku : price is under the cloud
Type : Bearish
Timeframe : Daily
Ichimoku - Bearish crossover : Tenkan & Kijun
Type : Bearish
Timeframe : Daily
Price is back over the pivot point
Type : Bullish
Timeframe : Daily
Central Patterns, the scanner specializing in chart patterns, did not identify any signals.
The Central Candlesticks scanner which studies Japanese candlesticks did not detect anything.
| S3 | S2 | S1 | Price | R1 | R2 | R3 | |
|---|---|---|---|---|---|---|---|
| ProTrendLines | 11,613.90 | 12,420.50 | 12,788.40 | 13,001.63 | 13,202.40 | 13,490.20 | 13,807.70 |
| Change (%) | -10.67% | -4.47% | -1.64% | - | +1.54% | +3.76% | +6.20% |
| Change | -1,387.73 | -581.13 | -213.23 | - | +200.77 | +488.57 | +806.07 |
| Level | Minor | Intermediate | Intermediate | - | Minor | Minor | Major |
To determine price objectives, it is also possible to use the pivot points. Here is the price position in relation to pivot points:
| Pivot points | S3 | S2 | S1 | PP | R1 | R2 | R3 |
|---|---|---|---|---|---|---|---|
| Standard | 12,630.53 | 12,798.86 | 12,900.24 | 13,068.57 | 13,169.95 | 13,338.28 | 13,439.66 |
| Camarilla | 12,927.46 | 12,952.18 | 12,976.91 | 13,001.63 | 13,026.35 | 13,051.08 | 13,075.80 |
| Woodie | 12,597.07 | 12,782.12 | 12,866.78 | 13,051.83 | 13,136.49 | 13,321.54 | 13,406.20 |
| Fibonacci | 12,798.86 | 12,901.89 | 12,965.54 | 13,068.57 | 13,171.60 | 13,235.25 | 13,338.28 |
| Pivot points | S3 | S2 | S1 | PP | R1 | R2 | R3 |
|---|---|---|---|---|---|---|---|
| Standard | 12,866.60 | 13,131.36 | 13,425.49 | 13,690.25 | 13,984.38 | 14,249.14 | 14,543.27 |
| Camarilla | 13,565.94 | 13,617.17 | 13,668.40 | 13,719.63 | 13,770.86 | 13,822.09 | 13,873.33 |
| Woodie | 12,881.30 | 13,138.70 | 13,440.19 | 13,697.59 | 13,999.08 | 14,256.48 | 14,557.97 |
| Fibonacci | 13,131.36 | 13,344.85 | 13,476.75 | 13,690.25 | 13,903.74 | 14,035.64 | 14,249.14 |
| Pivot points | S3 | S2 | S1 | PP | R1 | R2 | R3 |
|---|---|---|---|---|---|---|---|
| Standard | 12,568.90 | 12,912.36 | 13,386.56 | 13,730.02 | 14,204.22 | 14,547.68 | 15,021.88 |
| Camarilla | 13,635.90 | 13,710.86 | 13,785.81 | 13,860.76 | 13,935.71 | 14,010.66 | 14,085.62 |
| Woodie | 12,634.27 | 12,945.05 | 13,451.93 | 13,762.71 | 14,269.59 | 14,580.37 | 15,087.25 |
| Fibonacci | 12,912.36 | 13,224.71 | 13,417.67 | 13,730.02 | 14,042.37 | 14,235.33 | 14,547.68 |
Numerical data
The following is the status of the technical indicators and moving averages at the time of publication of this technical analysis:
| RSI (14): | 34.32 | |
| MACD (12,26,9): | -53.3100 | |
| Directional Movement: | -21.43 | |
| AROON (14): | -64.29 | |
| DEMA (21): | 13,582.57 | |
| Parabolic SAR (0,02-0,02-0,2): | 13,793.70 | |
| Elder Ray (13): | -446.21 | |
| Super Trend (3,10): | 13,826.67 | |
| Zig ZAG (10): | 13,001.63 | |
| VORTEX (21): | 0.7300 | |
| Stochastique (14,3,5): | 9.80 | |
| TEMA (21): | 13,416.12 | |
| Williams %R (14): | -96.89 | |
| Chande Momentum Oscillator (20): | -1,024.53 | |
| Repulse (5,40,3): | -1.6200 | |
| ROCnROLL: | 2 | |
| TRIX (15,9): | 0.0800 | |
| Courbe Coppock: | 6.63 |
| MA7: | 13,441.91 | |
| MA20: | 13,751.81 | |
| MA50: | 13,374.68 | |
| MA100: | 13,266.70 | |
| MAexp7: | 13,413.45 | |
| MAexp20: | 13,592.04 | |
| MAexp50: | 13,478.52 | |
| MAexp100: | 13,156.07 | |
| Price / MA7: | -3.28% | |
| Price / MA20: | -5.46% | |
| Price / MA50: | -2.79% | |
| Price / MA100: | -2.00% | |
| Price / MAexp7: | -3.07% | |
| Price / MAexp20: | -4.34% | |
| Price / MAexp50: | -3.54% | |
| Price / MAexp100: | -1.17% |
News
The latest news and videos published on NASDAQ100 INDEX at the time of the analysis were as follows:
-
 “Buzz on the Street” Show: Meten EdtechX (NASDAQ: METX) Achieves Positive Cash Flow in March 2021
-
S&P 500 and NASDAQ 100 Forecast May 13, 2021
-
Dollar Prepared for Nasdaq Volatility if Inflation Data Can Stir Interest
-
S&P 500 and NASDAQ 100 Forecast May 12, 2021
-
Two options trade ideas on Nasdaq and S&P 500
About author

Online


Add a comment
Comments
0 comments on the analysis NASDAQ100 INDEX - Daily