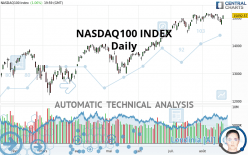
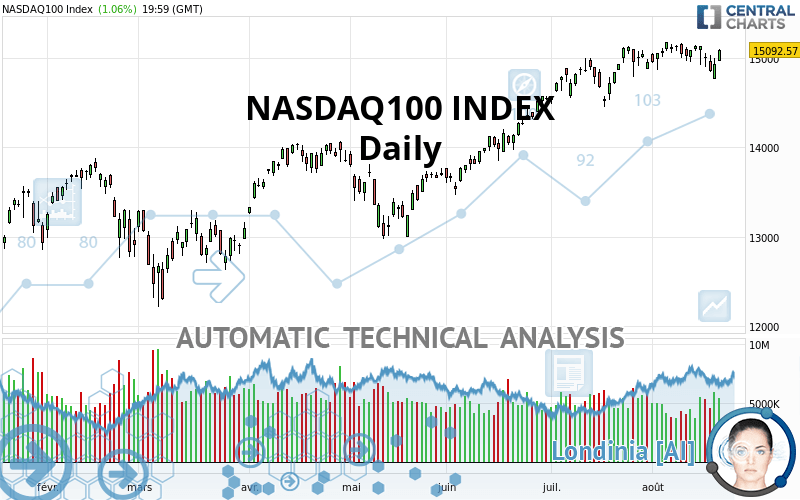
NASDAQ100 INDEX - Daily - Technical analysis published on 08/22/2021 (GMT)
- 215
- 0
Click here for a new analysis!
- Timeframe : Daily
- - Analysis generated on
- Status : TARGET REACHED
Summary of the analysis

Additional analysis
Quotes
NASDAQ100 INDEX rating 15,092.57 USD. On the day, this instrument gained +1.06% and was traded between 14,968.87 USD and 15,103.94 USD over the period. The price is currently at +0.83% from its lowest and -0.08% from its highest.A bullish opening was detected by the Central Gaps scanner. Buyers are trying to impose a bullish momentum in the very short term.
Bullish opening
Type : Bullish
Timeframe : Openning
A study of price movements over other periods shows the following variations:
Near a new HIGH record (5 years)
Type : Bullish
Timeframe : Weekly
Near a new HIGH record (1 year)
Type : Bullish
Timeframe : Weekly
Near a new HIGH record (1st january)
Type : Bullish
Timeframe : Weekly
Technical
Technical analysis of NASDAQ100 INDEX in Daily shows a strongly overall bullish trend. 89.29% of the signals given by moving averages are bullish. The slightly bullish signals given by the short-term moving averages indicate this trend is showing signs of running out of steam. The Central Indicators market scanner is currently detecting several bearish and bullish signals that could impact this trend:
Bearish trend reversal : Moving Average 20
Type : Bearish
Timeframe : Daily
Bullish price crossover with adaptative moving average 50
Type : Bullish
Timeframe : Daily
An assessment of technical indicators does not currently provide any relevant information on the direction of future price movements.
Caution: the Central Indicators scanner currently detects an excess:
CCI indicator is oversold : under -100
Type : Neutral
Timeframe : Daily
Previous candle closed under Bollinger bands
Type : Neutral
Timeframe : Daily
Pivot points : price is over resistance 1
Type : Neutral
Timeframe : Daily
RSI indicator is back over 50
Type : Bullish
Timeframe : Daily
No signals are given by Central Patterns, a market scanner specialised in chart patterns, resistances and supports.
The presence of a bullish Japanese candlestick pattern detected by Central Candlesticks that could cause a very short term rebound was also detected:
Piercing line
Type : Bullish
Timeframe : Daily
| S3 | S2 | S1 | Price | R1 | |
|---|---|---|---|---|---|
| ProTrendLines | 13,001.60 | 14,041.90 | 14,549.10 | 15,092.57 | 15,181.60 |
| Change (%) | -13.85% | -6.96% | -3.60% | - | +0.59% |
| Change | -2,090.97 | -1,050.67 | -543.47 | - | +89.03 |
| Level | Minor | Major | Minor | - | Major |
Pivot points can also be used to set your price objectives. Here is the price situation in relation to pivot points:
| Pivot points | S3 | S2 | S1 | PP | R1 | R2 | R3 |
|---|---|---|---|---|---|---|---|
| Standard | 14,871.24 | 14,920.06 | 15,006.31 | 15,055.13 | 15,141.38 | 15,190.20 | 15,276.45 |
| Camarilla | 15,055.43 | 15,067.81 | 15,080.19 | 15,092.57 | 15,104.95 | 15,117.33 | 15,129.71 |
| Woodie | 14,889.97 | 14,929.42 | 15,025.04 | 15,064.49 | 15,160.11 | 15,199.56 | 15,295.18 |
| Fibonacci | 14,920.06 | 14,971.65 | 15,003.53 | 15,055.13 | 15,106.72 | 15,138.60 | 15,190.20 |
| Pivot points | S3 | S2 | S1 | PP | R1 | R2 | R3 |
|---|---|---|---|---|---|---|---|
| Standard | 14,494.32 | 14,633.76 | 14,863.16 | 15,002.60 | 15,232.00 | 15,371.44 | 15,600.84 |
| Camarilla | 14,991.14 | 15,024.95 | 15,058.76 | 15,092.57 | 15,126.38 | 15,160.19 | 15,194.00 |
| Woodie | 14,539.31 | 14,656.25 | 14,908.15 | 15,025.09 | 15,276.99 | 15,393.93 | 15,645.83 |
| Fibonacci | 14,633.76 | 14,774.65 | 14,861.70 | 15,002.60 | 15,143.49 | 15,230.54 | 15,371.44 |
| Pivot points | S3 | S2 | S1 | PP | R1 | R2 | R3 |
|---|---|---|---|---|---|---|---|
| Standard | 13,875.23 | 14,165.17 | 14,562.53 | 14,852.47 | 15,249.83 | 15,539.77 | 15,937.13 |
| Camarilla | 14,770.89 | 14,833.90 | 14,896.90 | 14,959.90 | 15,022.90 | 15,085.91 | 15,148.91 |
| Woodie | 13,928.95 | 14,192.03 | 14,616.25 | 14,879.33 | 15,303.55 | 15,566.63 | 15,990.85 |
| Fibonacci | 14,165.17 | 14,427.72 | 14,589.92 | 14,852.47 | 15,115.02 | 15,277.22 | 15,539.77 |
Numerical data
The following are the details of the technical indicators and moving averages that were collected to generate this technical analysis:
| RSI (14): | 57.12 | |
| MACD (12,26,9): | 77.7100 | |
| Directional Movement: | -6.18 | |
| AROON (14): | -71.43 | |
| DEMA (21): | 15,124.82 | |
| Parabolic SAR (0,02-0,02-0,2): | 15,118.94 | |
| Elder Ray (13): | 10.80 | |
| Super Trend (3,10): | 14,704.31 | |
| Zig ZAG (10): | 15,092.57 | |
| VORTEX (21): | 0.9700 | |
| Stochastique (14,3,5): | 40.06 | |
| TEMA (21): | 15,039.15 | |
| Williams %R (14): | -22.31 | |
| Chande Momentum Oscillator (20): | 9.17 | |
| Repulse (5,40,3): | 1.5400 | |
| ROCnROLL: | 1 | |
| TRIX (15,9): | 0.1100 | |
| Courbe Coppock: | 0.01 |
| MA7: | 15,036.24 | |
| MA20: | 15,048.84 | |
| MA50: | 14,742.19 | |
| MA100: | 14,201.16 | |
| MAexp7: | 15,023.07 | |
| MAexp20: | 14,994.88 | |
| MAexp50: | 14,716.07 | |
| MAexp100: | 14,274.38 | |
| Price / MA7: | +0.37% | |
| Price / MA20: | +0.29% | |
| Price / MA50: | +2.38% | |
| Price / MA100: | +6.28% | |
| Price / MAexp7: | +0.46% | |
| Price / MAexp20: | +0.65% | |
| Price / MAexp50: | +2.56% | |
| Price / MAexp100: | +5.73% |
News
The latest news and videos published on NASDAQ100 INDEX at the time of the analysis were as follows:
-
 “The Buzz'' Show: Greenpro Capital Corp. (NASDAQ: GRNQ) MOU to Develop Integrated Satellite Network
-
S&P 500 and NASDAQ 100 Forecast August 23, 2021
-
“The Buzz'' Show: GeoVax Labs, Inc (NASDAQ: GOVX) Data on Covid-19 Vaccine Studies
-
S&P 500 and NASDAQ 100 Forecast August 20, 2021
-
S&P 500 and NASDAQ 100 Forecast August 19, 2021
About author

Online


Add a comment
Comments
0 comments on the analysis NASDAQ100 INDEX - Daily