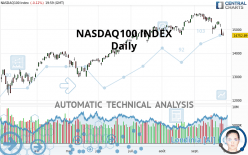
NASDAQ100 INDEX - Daily - Technical analysis published on 09/30/2021 (GMT)
- 300
- 0
Click here for a new analysis!
- Timeframe : Daily
- - Analysis generated on
- Status : TARGET REACHED

Summary of the analysis

Additional analysis
Quotes
The NASDAQ100 INDEX rating is 14,752.89 USD. The price registered a decrease of -0.12% on the session with the lowest point at 14,727.41 USD and the highest point at 14,914.92 USD. The deviation from the price is +0.17% for the low point and -1.09% for the high point.The Central Gaps scanner detects a bullish opening. A small advantage for buyers in the very short term.
Bullish opening
Type : Bullish
Timeframe : Openning
So that you have an overall view of the price change, here is a table showing the variations over several periods:
Near a new HIGH record (5 years)
Type : Bullish
Timeframe : Weekly
Technical
A technical analysis in Daily of this NASDAQ100 INDEX chart shows a slightly bullish trend. 57.14% of the signals given by moving averages are bullish. Caution: the strong bearish signals currently given by short-term moving averages indicate that a trend reversal may be taking place. The Central Indicators scanner detects bearish signals on moving averages that could impact this trend:
Bearish trend reversal : adaptative moving average 50
Type : Bearish
Timeframe : Daily
Moving Average bearish crossovers : AMA20 & AMA50
Type : Bearish
Timeframe : Daily
Bearish price crossover with adaptative moving average 100
Type : Bearish
Timeframe : Daily
An assessment of technical indicators does not currently provide any relevant information on the direction of future price movements.
Caution: the Central Indicators scanner currently detects an excess:
CCI indicator is oversold : under -100
Type : Neutral
Timeframe : Daily
Williams %R indicator is oversold : under -80
Type : Neutral
Timeframe : Daily
Pivot points : price is under support 1
Type : Neutral
Timeframe : Weekly
Price is back over the pivot point
Type : Bullish
Timeframe : Weekly
Price is back under the pivot point
Type : Bearish
Timeframe : Daily
Central Patterns, the scanner specializing in chart patterns, did not identify any signals.
The presence of a bearish pattern in Japanese candlesticks detected by Central Candlesticks that could cause a correction in the very short term was also detected:
Downside gap
Type : Bearish
Timeframe : Daily
| S3 | S2 | S1 | Price | R1 | R2 | R3 | |
|---|---|---|---|---|---|---|---|
| ProTrendLines | 13,001.60 | 14,041.90 | 14,549.10 | 14,752.89 | 14,857.90 | 15,181.60 | 15,675.80 |
| Change (%) | -11.87% | -4.82% | -1.38% | - | +0.71% | +2.91% | +6.26% |
| Change | -1,751.29 | -710.99 | -203.79 | - | +105.01 | +428.71 | +922.91 |
| Level | Intermediate | Major | Minor | - | Major | Minor | Major |
Pivot points can also be used to set your price objectives. Here is the price situation in relation to pivot points:
| Pivot points | S3 | S2 | S1 | PP | R1 | R2 | R3 |
|---|---|---|---|---|---|---|---|
| Standard | 14,494.38 | 14,610.90 | 14,681.89 | 14,798.41 | 14,869.40 | 14,985.92 | 15,056.91 |
| Camarilla | 14,701.33 | 14,718.51 | 14,735.70 | 14,752.89 | 14,770.08 | 14,787.27 | 14,804.46 |
| Woodie | 14,471.63 | 14,599.52 | 14,659.14 | 14,787.03 | 14,846.65 | 14,974.54 | 15,034.16 |
| Fibonacci | 14,610.90 | 14,682.53 | 14,726.78 | 14,798.41 | 14,870.04 | 14,914.29 | 14,985.92 |
| Pivot points | S3 | S2 | S1 | PP | R1 | R2 | R3 |
|---|---|---|---|---|---|---|---|
| Standard | 14,445.56 | 14,633.28 | 14,981.48 | 15,169.20 | 15,517.40 | 15,705.12 | 16,053.32 |
| Camarilla | 15,182.30 | 15,231.43 | 15,280.55 | 15,329.68 | 15,378.81 | 15,427.93 | 15,477.06 |
| Woodie | 14,525.80 | 14,673.40 | 15,061.72 | 15,209.32 | 15,597.64 | 15,745.24 | 16,133.56 |
| Fibonacci | 14,633.28 | 14,838.00 | 14,964.48 | 15,169.20 | 15,373.92 | 15,500.40 | 15,705.12 |
| Pivot points | S3 | S2 | S1 | PP | R1 | R2 | R3 |
|---|---|---|---|---|---|---|---|
| Standard | 14,182.87 | 14,478.03 | 15,030.27 | 15,325.43 | 15,877.67 | 16,172.83 | 16,725.07 |
| Camarilla | 15,349.47 | 15,427.14 | 15,504.82 | 15,582.50 | 15,660.18 | 15,737.86 | 15,815.54 |
| Woodie | 14,311.40 | 14,542.30 | 15,158.80 | 15,389.70 | 16,006.20 | 16,237.10 | 16,853.60 |
| Fibonacci | 14,478.03 | 14,801.74 | 15,001.73 | 15,325.43 | 15,649.14 | 15,849.13 | 16,172.83 |
Numerical data
The following is the status of the technical indicators and moving averages at the time of publication of this technical analysis:
| RSI (14): | 33.53 | |
| MACD (12,26,9): | -78.4300 | |
| Directional Movement: | -22.57 | |
| AROON (14): | -100.00 | |
| DEMA (21): | 15,158.44 | |
| Parabolic SAR (0,02-0,02-0,2): | 15,286.88 | |
| Elder Ray (13): | -337.89 | |
| Super Trend (3,10): | 15,465.34 | |
| Zig ZAG (10): | 14,752.89 | |
| VORTEX (21): | 0.7900 | |
| Stochastique (14,3,5): | 16.28 | |
| TEMA (21): | 14,987.57 | |
| Williams %R (14): | -97.31 | |
| Chande Momentum Oscillator (20): | -681.61 | |
| Repulse (5,40,3): | -1.9100 | |
| ROCnROLL: | 2 | |
| TRIX (15,9): | 0.0100 | |
| Courbe Coppock: | 6.38 |
| MA7: | 15,082.65 | |
| MA20: | 15,346.40 | |
| MA50: | 15,214.76 | |
| MA100: | 14,632.31 | |
| MAexp7: | 15,041.42 | |
| MAexp20: | 15,214.62 | |
| MAexp50: | 15,111.47 | |
| MAexp100: | 14,717.96 | |
| Price / MA7: | -2.19% | |
| Price / MA20: | -3.87% | |
| Price / MA50: | -3.04% | |
| Price / MA100: | +0.82% | |
| Price / MAexp7: | -1.92% | |
| Price / MAexp20: | -3.03% | |
| Price / MAexp50: | -2.37% | |
| Price / MAexp100: | +0.24% |
News
The latest news and videos published on NASDAQ100 INDEX at the time of the analysis were as follows:
-
 “The Buzz'' Show: Geovax Labs Inc. (NASDAQ: GOVX) Licensing Agreement with PNP Therapeutics
-
“The Buzz'' Show: NuCana PLC (NASDAQ: NCNA) FDA Fast Track Designation for Acelarin
-
S&P 500 and NASDAQ 100 Forecast September 30, 2021
-
“The Buzz'' Show: Alfi Inc. (NASDAQ: ALF) Partnership with Vistar Media
-
S&P 500 and NASDAQ 100 Forecast September 29, 2021
About author

Online


Add a comment
Comments
0 comments on the analysis NASDAQ100 INDEX - Daily