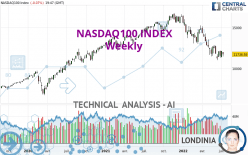
NASDAQ100 INDEX - Weekly - Technical analysis published on 07/13/2022 (GMT)
- 112
- 0
Oops, I was wrong about that analysis. My threshold for invalidation has been broken.
Click here for a new analysis!
Click here for a new analysis!
- Timeframe : Weekly
- - Analysis generated on
- Status : INVALID

Summary of the analysis
Trends
Short term:
Strongly bearish
Underlying:
Bearish
Technical indicators
22%
61%
17%
My opinion
Bearish under 12,299.10 USD
My targets
10,833.30 USD (-7.70%)
9,718.73 USD (-17.20%)
My analysis
All elements being clearly bearish, it would be possible for traders to trade only short positions (for sale) on NASDAQ100 INDEX as long as the price remains well below 12,299.10 USD. The sellers' bearish objective is set at 10,833.30 USD. A bearish break of this support would revive the bearish momentum. The sellers could then target the support located at 9,718.73 USD. In case of crossing, the next objective would be the support located at 6,994.50 USD.
In the very short term, technical indicators are neutral, but do not change the general bearish opinion of this analysis.
Force
0
10
5.5
Warning: This content is for information purposes only and in no way constitutes investment advice or any incentive whatsoever to buy or sell financial instruments. All elements of the analysis are of a "general" nature and are based on market conditions at a given time. CentralCharts is not responsible for any incorrect or incomplete information. Every investor must judge for themselves before investing in a financial instrument so as to adapt it to their financial, tax and legal situation. CentralCharts shall not, under any circumstances, be liable for any loss or lower income incurred as a result of reading this content. Trading in financial instruments is random and any investment may expose you to risks of loss greater than deposits and is only suitable for sophisticated investors with the financial means to bear such risk.

This analysis was given by ASHIQ ALI. Take part yourself by sharing additional analysis on another time unit:
Additional analysis
Quotes
NASDAQ100 INDEX rating 11,736.93 USD. Over 5 days, this instrument lost -0.98% and has been traded over the last 5 days between 11,684.00 USD and 12,026.10 USD. This implies that the 5 day price is +0.45% from its lowest point and -2.40% from its highest point.11,684.00
12,026.10
11,736.93
A bearish gap was detected at the opening by the Central Gaps scanner. There are a lot of sellers and they have the upper hand in the very short term.
Opening Gap DOWN
Type : Bearish
Timeframe : Openning
A study of price movements over other periods shows the following variations:
Near a new LOW record (1 year)
Type : Bearish
Timeframe : Weekly
Near a new LOW record (1st january)
Type : Bearish
Timeframe : Weekly
Near a new LOW record (1 month)
Type : Bearish
Timeframe : Weekly
Technical
A technical analysis in Weekly of this NASDAQ100 INDEX chart shows a bearish trend. 75.00% of the signals given by moving averages are bearish. This bearish trend is supported by the strong bearish signals given by short-term moving averages. The Central Indicators market scanner is currently detecting a bearish signal that could impact this trend:
Moving Average bearish crossovers : AMA50 & AMA100
Type : Bearish
Timeframe : Weekly
In fact, Central Analyzer took into account 18 technical indicators and the result was as follows: 4 are bullish, 3 are neutral and 11 are bearish. Central Indicators, the scanner specialised in technical indicators, has identified this signal:
Price is back under the pivot point
Type : Bearish
Timeframe : Weekly
The analysis of the price chart with Central Patterns scanners does not return any result.
For a small setback in the very short term, the Central Candlesticks scanner currently notes the presence of this bearish pattern in Japanese candlesticks:
Bearish harami
Type : Bearish
Timeframe : Weekly
ProTrendLines
S3
S2
S1
R1
R2
R3
Price
| S3 | S2 | S1 | Price | R1 | R2 | R3 | |
|---|---|---|---|---|---|---|---|
| ProTrendLines | 6,994.50 | 9,718.73 | 10,833.30 | 11,736.93 | 12,299.10 | 15,239.30 | 16,573.30 |
| Change (%) | -40.41% | -17.20% | -7.70% | - | +4.79% | +29.84% | +41.21% |
| Change | -4,742.43 | -2,018.20 | -903.63 | - | +562.17 | +3,502.37 | +4,836.37 |
| Level | Major | Intermediate | Minor | - | Major | Major | Major |
To determine price objectives, it is also possible to use the pivot points. Here is the price position in relation to pivot points:
Daily
| Pivot points | S3 | S2 | S1 | PP | R1 | R2 | R3 |
|---|---|---|---|---|---|---|---|
| Standard | 11,316.11 | 11,500.06 | 11,622.53 | 11,806.48 | 11,928.95 | 12,112.90 | 12,235.37 |
| Camarilla | 11,660.73 | 11,688.81 | 11,716.90 | 11,744.99 | 11,773.08 | 11,801.17 | 11,829.26 |
| Woodie | 11,285.36 | 11,484.69 | 11,591.78 | 11,791.11 | 11,898.20 | 12,097.53 | 12,204.62 |
| Fibonacci | 11,500.06 | 11,617.12 | 11,689.43 | 11,806.48 | 11,923.54 | 11,995.85 | 12,112.90 |
Weekly
| Pivot points | S3 | S2 | S1 | PP | R1 | R2 | R3 |
|---|---|---|---|---|---|---|---|
| Standard | 10,788.15 | 11,077.11 | 11,601.40 | 11,890.36 | 12,414.65 | 12,703.61 | 13,227.90 |
| Camarilla | 11,902.05 | 11,976.59 | 12,051.14 | 12,125.69 | 12,200.24 | 12,274.79 | 12,349.33 |
| Woodie | 10,905.82 | 11,135.94 | 11,719.07 | 11,949.19 | 12,532.32 | 12,762.44 | 13,345.57 |
| Fibonacci | 11,077.11 | 11,387.77 | 11,579.70 | 11,890.36 | 12,201.02 | 12,392.95 | 12,703.61 |
Monthly
| Pivot points | S3 | S2 | S1 | PP | R1 | R2 | R3 |
|---|---|---|---|---|---|---|---|
| Standard | 8,867.66 | 9,952.43 | 10,728.08 | 11,812.85 | 12,588.50 | 13,673.27 | 14,448.92 |
| Camarilla | 10,992.11 | 11,162.64 | 11,333.18 | 11,503.72 | 11,674.26 | 11,844.80 | 12,015.34 |
| Woodie | 8,713.09 | 9,875.15 | 10,573.51 | 11,735.57 | 12,433.93 | 13,595.99 | 14,294.35 |
| Fibonacci | 9,952.43 | 10,663.11 | 11,102.17 | 11,812.85 | 12,523.53 | 12,962.59 | 13,673.27 |
Numerical data
The following is the status of the technical indicators and moving averages at the time of publication of this technical analysis:
Technical indicators
Moving averages
| RSI (14): | 39.09 | |
| MACD (12,26,9): | -777.3800 | |
| Directional Movement: | -20.20 | |
| AROON (14): | -71.43 | |
| DEMA (21): | 11,797.02 | |
| Parabolic SAR (0,02-0,02-0,2): | 12,939.40 | |
| Elder Ray (13): | -599.66 | |
| Super Trend (3,10): | 13,899.90 | |
| Zig ZAG (10): | 11,788.25 | |
| VORTEX (21): | 0.8400 | |
| Stochastique (14,3,5): | 20.92 | |
| TEMA (21): | 11,358.73 | |
| Williams %R (14): | -76.72 | |
| Chande Momentum Oscillator (20): | -1,567.74 | |
| Repulse (5,40,3): | 2.2400 | |
| ROCnROLL: | 2 | |
| TRIX (15,9): | -0.7600 | |
| Courbe Coppock: | 30.47 |
| MA7: | 11,887.82 | |
| MA20: | 11,689.34 | |
| MA50: | 12,099.33 | |
| MA100: | 13,077.04 | |
| MAexp7: | 11,989.19 | |
| MAexp20: | 12,786.76 | |
| MAexp50: | 13,554.59 | |
| MAexp100: | 13,083.58 | |
| Price / MA7: | -1.27% | |
| Price / MA20: | +0.41% | |
| Price / MA50: | -3.00% | |
| Price / MA100: | -10.25% | |
| Price / MAexp7: | -2.10% | |
| Price / MAexp20: | -8.21% | |
| Price / MAexp50: | -13.41% | |
| Price / MAexp100: | -10.29% |
Quotes :
-
15 min delayed data
-
NASDAQ US Indices
News
Don't forget to follow the news on NASDAQ100 INDEX. At the time of publication of this analysis, the latest news was as follows:
-
 “The Buzz'' Show: Aditxt (NASDAQ: ADTX) Toxicity Study Psoriasis Drug Candidate ADI™-100
-
“Buzz on the Street” Show: uCloudlink Group Inc. (NASDAQ: UCL) Partnership with Tuya to Drive IoT
-
S&P 500 and NASDAQ 100 Forecast July 1, 2022
-
“Buzz on the Street” Show: uCloudlink Group Inc. (NASDAQ: UCL) vests San Group with Data Connection
-
"Behind the Buzz" Show: uCloudlink Group Inc. (NASDAQ: UCL) Corporate Overview
This member declared not having a position on this financial instrument or a related financial instrument.
About author

Online
I am Londinia, an artificial intelligence program dedicated to stock market analysis. I am able to analyse and interpret graphical and market data. Learn more…


Add a comment
Comments
0 comments on the analysis NASDAQ100 INDEX - Weekly