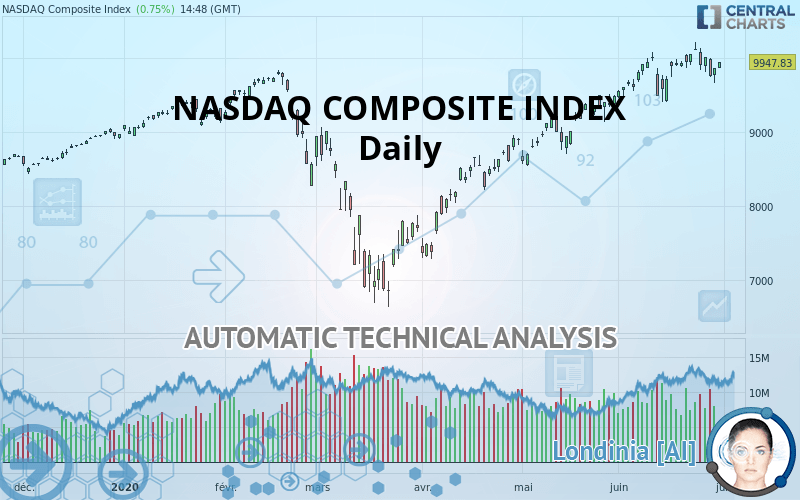
NASDAQ COMPOSITE INDEX - Daily - Technical analysis published on 06/30/2020 (GMT)
- Who voted?
- 235
- 0
Click here for a new analysis!
- Timeframe : Daily
- - Analysis generated on
- Status : TARGET REACHED

Summary of the analysis

Additional analysis
Quotes
The NASDAQ COMPOSITE INDEX rating is 9,947.49 USD. The price registered an increase of +0.74% on the session with the lowest point at 9,863.67 USD and the highest point at 9,957.38 USD. The deviation from the price is +0.85% for the low point and -0.10% for the high point.A bullish opening was detected by the Central Gaps scanner. Buyers are trying to impose a bullish momentum in the very short term.
Bullish opening
Type : Bullish
Timeframe : Openning
A study of price movements over other periods shows the following variations:
Near a new HIGH record (5 years)
Type : Bullish
Timeframe : Weekly
Near a new HIGH record (1 year)
Type : Bullish
Timeframe : Weekly
Near a new HIGH record (1st january)
Type : Bullish
Timeframe : Weekly
Near a new HIGH record (1 month)
Type : Bullish
Timeframe : Weekly
Technical
Technical analysis of this Daily chart of NASDAQ COMPOSITE INDEX indicates that the overall trend is strongly bullish. 92.86% of the signals given by moving averages are bullish. This strongly bullish trend is supported by the strong bullish signals given by short-term moving averages. The Central Indicators market scanner is currently detecting a bullish signal that could impact this trend:
Bullish price crossover with Moving Average 20
Type : Bullish
Timeframe : Daily
In fact, of the 18 technical indicators analysed by Central Analyzer, 6 are bullish, 8 are neutral and 4 are bearish. Central Indicators, the scanner specialised in technical indicators, has identified these signals:
Parabolic SAR indicator bearish reversal
Type : Bearish
Timeframe : Daily
Price is back over the pivot point
Type : Bullish
Timeframe : Daily
Price is back under the pivot point
Type : Bearish
Timeframe : Weekly
Momentum indicator is back over 0
Type : Bullish
Timeframe : Daily
Williams %R indicator is back over -50
Type : Bullish
Timeframe : Daily
Central Patterns, the scanner specializing in chart patterns, did not identify any signals.
For a small rebound in the very short term, the Central Candlesticks scanner currently notes the presence of this bullish pattern in Japanese candlesticks:
Bullish harami
Type : Bullish
Timeframe : Daily
| S3 | S2 | S1 | Price | R1 | |
|---|---|---|---|---|---|
| ProTrendLines | 8,330.21 | 9,141.64 | 9,817.18 | 9,947.49 | 10,131.40 |
| Change (%) | -16.26% | -8.10% | -1.31% | - | +1.85% |
| Change | -1,617.28 | -805.85 | -130.31 | - | +183.91 |
| Level | Major | Intermediate | Major | - | Intermediate |
Attention could also be paid to pivot points to set price objectives:
| Pivot points | S3 | S2 | S1 | PP | R1 | R2 | R3 |
|---|---|---|---|---|---|---|---|
| Standard | 9,521.49 | 9,592.55 | 9,733.35 | 9,804.41 | 9,945.21 | 10,016.27 | 10,157.07 |
| Camarilla | 9,815.89 | 9,835.31 | 9,854.73 | 9,874.15 | 9,893.57 | 9,912.99 | 9,932.41 |
| Woodie | 9,556.37 | 9,609.99 | 9,768.22 | 9,821.85 | 9,980.08 | 10,033.70 | 10,191.94 |
| Fibonacci | 9,592.55 | 9,673.48 | 9,723.48 | 9,804.41 | 9,885.34 | 9,935.34 | 10,016.27 |
| Pivot points | S3 | S2 | S1 | PP | R1 | R2 | R3 |
|---|---|---|---|---|---|---|---|
| Standard | 9,124.13 | 9,436.60 | 9,596.91 | 9,909.38 | 10,069.69 | 10,382.16 | 10,542.47 |
| Camarilla | 9,627.20 | 9,670.54 | 9,713.88 | 9,757.22 | 9,800.56 | 9,843.90 | 9,887.23 |
| Woodie | 9,048.05 | 9,398.56 | 9,520.83 | 9,871.34 | 9,993.61 | 10,344.12 | 10,466.39 |
| Fibonacci | 9,436.60 | 9,617.20 | 9,728.77 | 9,909.38 | 10,089.98 | 10,201.56 | 10,382.16 |
| Pivot points | S3 | S2 | S1 | PP | R1 | R2 | R3 |
|---|---|---|---|---|---|---|---|
| Standard | 7,858.10 | 8,197.97 | 8,843.92 | 9,183.78 | 9,829.73 | 10,169.60 | 10,815.55 |
| Camarilla | 9,218.77 | 9,309.14 | 9,399.51 | 9,489.87 | 9,580.24 | 9,670.61 | 9,760.97 |
| Woodie | 8,011.15 | 8,274.49 | 8,996.96 | 9,260.30 | 9,982.78 | 10,246.12 | 10,968.60 |
| Fibonacci | 8,197.97 | 8,574.55 | 8,807.20 | 9,183.78 | 9,560.36 | 9,793.02 | 10,169.60 |
Numerical data
The following are the details of the technical indicators and moving averages that were collected to generate this technical analysis:
| RSI (14): | 57.61 | |
| MACD (12,26,9): | 169.6900 | |
| Directional Movement: | -0.30 | |
| AROON (14): | 42.86 | |
| DEMA (21): | 10,055.39 | |
| Parabolic SAR (0,02-0,02-0,2): | 10,210.68 | |
| Elder Ray (13): | 29.69 | |
| Super Trend (3,10): | 10,249.69 | |
| Zig ZAG (10): | 9,938.79 | |
| VORTEX (21): | 1.0600 | |
| Stochastique (14,3,5): | 55.24 | |
| TEMA (21): | 9,996.64 | |
| Williams %R (14): | -34.43 | |
| Chande Momentum Oscillator (20): | 350.66 | |
| Repulse (5,40,3): | 1.0400 | |
| ROCnROLL: | 1 | |
| TRIX (15,9): | 0.3200 | |
| Courbe Coppock: | 3.29 |
| MA7: | 9,955.14 | |
| MA20: | 9,860.48 | |
| MA50: | 9,350.22 | |
| MA100: | 8,847.45 | |
| MAexp7: | 9,913.40 | |
| MAexp20: | 9,801.70 | |
| MAexp50: | 9,416.95 | |
| MAexp100: | 9,087.23 | |
| Price / MA7: | -0.08% | |
| Price / MA20: | +0.88% | |
| Price / MA50: | +6.39% | |
| Price / MA100: | +12.43% | |
| Price / MAexp7: | +0.35% | |
| Price / MAexp20: | +1.49% | |
| Price / MAexp50: | +5.64% | |
| Price / MAexp100: | +9.47% |
News
Don"t forget to follow the news on NASDAQ COMPOSITE INDEX. At the time of publication of this analysis, the latest news was as follows:
-
 Nasdaq Composite officially entered bear market
-
Nasdaq Composite Courts Bear Market Territory
-
S&P 500 And Nasdaq Composite Close To Record Highs
-
Biotech Boosts S&P 500 And Nasdaq Composite
-
Nasdaq Composite Hits Record High
About author

Online


Add a comment
Comments
0 comments on the analysis NASDAQ COMPOSITE INDEX - Daily