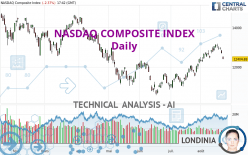
NASDAQ COMPOSITE INDEX - Daily - Technical analysis published on 08/22/2022 (GMT)
- 139
- 0
- Timeframe : Daily
- - Analysis generated on
- Status : NEUTRAL
Summary of the analysis
Trends
Short term:
Neutral
Underlying:
Neutral
Technical indicators
17%
39%
44%
My opinion
Neutral between 11,984.50 USD and 12,603.60 USD
My targets
-
My analysis
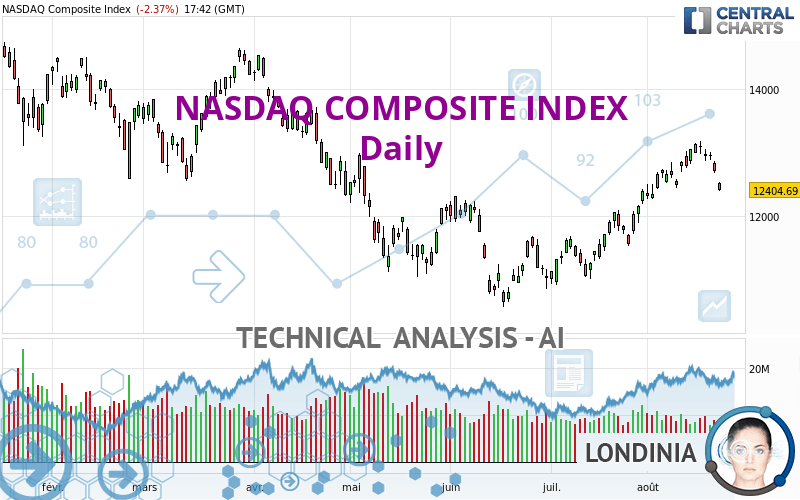
The short-term and basic trend is neutral. In this situation, the price of NASDAQ COMPOSITE INDEX could just as easily move towards the first resistance as the first support. No statistical advantage is given for one of these levels to be achieved before the other. It will be necessary to create a new automated analysis when the conditions have progressed. This may be the case, for example, when the first resistance has been broken above or the first support has been broken below. The first resistance is located at 12,603.60 USD. The first support is located at 11,984.50 USD.
In the very short term, technical indicators are bearish and could soon allow change to a bearish sentiment.
Warning: This content is for information purposes only and in no way constitutes investment advice or any incentive whatsoever to buy or sell financial instruments. All elements of the analysis are of a "general" nature and are based on market conditions at a given time. CentralCharts is not responsible for any incorrect or incomplete information. Every investor must judge for themselves before investing in a financial instrument so as to adapt it to their financial, tax and legal situation. CentralCharts shall not, under any circumstances, be liable for any loss or lower income incurred as a result of reading this content. Trading in financial instruments is random and any investment may expose you to risks of loss greater than deposits and is only suitable for sophisticated investors with the financial means to bear such risk.

This analysis was given by stein82. Take part yourself by sharing additional analysis on another time unit:
Additional analysis
Quotes
The NASDAQ COMPOSITE INDEX price is 12,404.69 USD. On the day, this instrument lost -2.37% and was traded between 12,398.38 USD and 12,538.55 USD over the period. The price is currently at +0.05% from its lowest and -1.07% from its highest.12,398.38
12,538.55
12,404.69
A bearish gap was detected at the opening by the Central Gaps scanner. There are a lot of sellers and they have the upper hand in the very short term.
Opening Gap DOWN
Type : Bearish
Timeframe : Openning
Here is a more detailed summary of the historical variations registered by NASDAQ COMPOSITE INDEX:
Technical
A technical analysis in Daily of this NASDAQ COMPOSITE INDEX chart shows a neutral trend. This indecision is confirmed by the neutral signals currently being given by short-term moving averages. The Central Indicators scanner detects bearish signals on moving averages that could impact this trend:
Bearish price crossover with Moving Average 20
Type : Bearish
Timeframe : Daily
Bearish price crossover with adaptative moving average 20
Type : Bearish
Timeframe : Daily
In fact, only 7 technical indicators out of 18 studied are currently positioned bearish. But beware of excesses. The Central Indicators scanner currently detects this:
Williams %R indicator is oversold : under -80
Type : Neutral
Timeframe : Daily
Pivot points : price is under support 1
Type : Neutral
Timeframe : Weekly
Pivot points : price is under support 3
Type : Neutral
Timeframe : Daily
RSI indicator is back under 50
Type : Bearish
Timeframe : Daily
Momentum indicator is back under 0
Type : Bearish
Timeframe : Daily
Central Patterns, the scanner specializing in chart patterns, did not identify any signals.
The presence of a bearish pattern in Japanese candlesticks detected by Central Candlesticks that could cause a correction in the very short term was also detected:
Downside gap
Type : Bearish
Timeframe : Daily
ProTrendLines
S3
S2
S1
R1
R2
R3
Price
| S3 | S2 | S1 | Price | R1 | R2 | R3 | |
|---|---|---|---|---|---|---|---|
| ProTrendLines | 10,643.50 | 11,258.80 | 11,984.50 | 12,404.69 | 12,603.60 | 13,352.80 | 14,609.20 |
| Change (%) | -14.20% | -9.24% | -3.39% | - | +1.60% | +7.64% | +17.77% |
| Change | -1,761.19 | -1,145.89 | -420.19 | - | +198.91 | +948.11 | +2,204.51 |
| Level | Major | Minor | Intermediate | - | Intermediate | Major | Major |
Pivot points can also be used to set your price objectives. Here is the price situation in relation to pivot points:
Daily
| Pivot points | S3 | S2 | S1 | PP | R1 | R2 | R3 |
|---|---|---|---|---|---|---|---|
| Standard | 12,449.58 | 12,562.22 | 12,633.72 | 12,746.36 | 12,817.86 | 12,930.50 | 13,002.00 |
| Camarilla | 12,654.57 | 12,671.45 | 12,688.33 | 12,705.21 | 12,722.09 | 12,738.97 | 12,755.85 |
| Woodie | 12,429.00 | 12,551.94 | 12,613.14 | 12,736.08 | 12,797.28 | 12,920.22 | 12,981.42 |
| Fibonacci | 12,562.22 | 12,632.57 | 12,676.02 | 12,746.36 | 12,816.71 | 12,860.16 | 12,930.50 |
Weekly
| Pivot points | S3 | S2 | S1 | PP | R1 | R2 | R3 |
|---|---|---|---|---|---|---|---|
| Standard | 12,020.14 | 12,347.50 | 12,526.36 | 12,853.72 | 13,032.58 | 13,359.94 | 13,538.80 |
| Camarilla | 12,566.00 | 12,612.40 | 12,658.81 | 12,705.21 | 12,751.61 | 12,798.02 | 12,844.42 |
| Woodie | 11,945.88 | 12,310.38 | 12,452.10 | 12,816.60 | 12,958.32 | 13,322.82 | 13,464.54 |
| Fibonacci | 12,347.50 | 12,540.88 | 12,660.35 | 12,853.72 | 13,047.10 | 13,166.57 | 13,359.94 |
Monthly
| Pivot points | S3 | S2 | S1 | PP | R1 | R2 | R3 |
|---|---|---|---|---|---|---|---|
| Standard | 9,877.86 | 10,394.66 | 11,392.67 | 11,909.47 | 12,907.48 | 13,424.28 | 14,422.29 |
| Camarilla | 11,974.12 | 12,112.98 | 12,251.83 | 12,390.69 | 12,529.55 | 12,668.41 | 12,807.26 |
| Woodie | 10,118.48 | 10,514.96 | 11,633.29 | 12,029.77 | 13,148.10 | 13,544.58 | 14,662.91 |
| Fibonacci | 10,394.66 | 10,973.31 | 11,330.81 | 11,909.47 | 12,488.12 | 12,845.62 | 13,424.28 |
Numerical data
The following is the status of the technical indicators and moving averages at the time of publication of this technical analysis:
Technical indicators
Moving averages
| RSI (14): | 49.12 | |
| MACD (12,26,9): | 264.7800 | |
| Directional Movement: | 2.49 | |
| AROON (14): | 71.43 | |
| DEMA (21): | 12,936.96 | |
| Parabolic SAR (0,02-0,02-0,2): | 13,170.96 | |
| Elder Ray (13): | -233.23 | |
| Super Trend (3,10): | 12,324.58 | |
| Zig ZAG (10): | 12,398.59 | |
| VORTEX (21): | 1.0000 | |
| Stochastique (14,3,5): | 41.79 | |
| TEMA (21): | 13,016.71 | |
| Williams %R (14): | -99.68 | |
| Chande Momentum Oscillator (20): | -319.41 | |
| Repulse (5,40,3): | -1.8400 | |
| ROCnROLL: | -1 | |
| TRIX (15,9): | 0.4000 | |
| Courbe Coppock: | 8.89 |
| MA7: | 12,898.66 | |
| MA20: | 12,598.61 | |
| MA50: | 11,833.46 | |
| MA100: | 12,210.44 | |
| MAexp7: | 12,753.59 | |
| MAexp20: | 12,564.92 | |
| MAexp50: | 12,236.86 | |
| MAexp100: | 12,411.59 | |
| Price / MA7: | -3.83% | |
| Price / MA20: | -1.54% | |
| Price / MA50: | +4.83% | |
| Price / MA100: | +1.59% | |
| Price / MAexp7: | -2.74% | |
| Price / MAexp20: | -1.28% | |
| Price / MAexp50: | +1.37% | |
| Price / MAexp100: | -0.06% |
Quotes :
-
15 min delayed data
-
NASDAQ US Indices
News
Don't forget to follow the news on NASDAQ COMPOSITE INDEX. At the time of publication of this analysis, the latest news was as follows:
-
 Nasdaq Composite officially entered bear market
-
Nasdaq Composite Courts Bear Market Territory
-
S&P 500 And Nasdaq Composite Close To Record Highs
-
Biotech Boosts S&P 500 And Nasdaq Composite
-
Nasdaq Composite Hits Record High
This member declared not having a position on this financial instrument or a related financial instrument.
About author

Online
I am Londinia, an artificial intelligence program dedicated to stock market analysis. I am able to analyse and interpret graphical and market data. Learn more…


Add a comment
Comments
0 comments on the analysis NASDAQ COMPOSITE INDEX - Daily