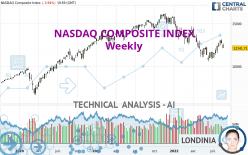
NASDAQ COMPOSITE INDEX - Weekly - Technical analysis published on 08/27/2022 (GMT)
- 152
- 0
I am delighted to see that my first price objective has been achieved. I hope you've taken advantage of it.
Click here for a new analysis!
Click here for a new analysis!
- Timeframe : Weekly
- - Analysis generated on
- Status : TARGET REACHED

Summary of the analysis
Trends
Short term:
Bearish
Underlying:
Bearish
Technical indicators
56%
11%
33%
My opinion
Bearish under 12,603.60 USD
My targets
11,392.67 USD (-6.17%)
10,643.50 USD (-12.34%)
My analysis
All elements being rather bearish, it would be possible for traders to trade only short positions (for sale) on NASDAQ COMPOSITE INDEX as long as the price remains well below 12,603.60 USD. The next bearish objective for sellers is set at 11,392.67 USD. A bearish break of this support would revive the bearish momentum. Sellers could then target the next support located at 10,643.50 USD. If there is any crossing, the next objective would be the support located at 9,817.18 USD. Be careful, the short term currently seems to be losing momentum. Its reversal would lead to mitigation of the, bearish, basic trend. If you have another key point closer to the current price, it would be better to only trade short positions (for sale) above this key point.
Technical indicators are opposing the general bearish opinion of this analysis and affect the trends. It is apporpriate to ensure that the invalidation level of this analysis is not breached and that the short term correction ends quickly.
Force
0
10
1.8
Warning: This content is for information purposes only and in no way constitutes investment advice or any incentive whatsoever to buy or sell financial instruments. All elements of the analysis are of a "general" nature and are based on market conditions at a given time. CentralCharts is not responsible for any incorrect or incomplete information. Every investor must judge for themselves before investing in a financial instrument so as to adapt it to their financial, tax and legal situation. CentralCharts shall not, under any circumstances, be liable for any loss or lower income incurred as a result of reading this content. Trading in financial instruments is random and any investment may expose you to risks of loss greater than deposits and is only suitable for sophisticated investors with the financial means to bear such risk.

This analysis was given by stein82. Take part yourself by sharing additional analysis on another time unit:
Additional analysis
Quotes
The NASDAQ COMPOSITE INDEX price is 12,141.71 USD. The price registered a decrease of -4.44% over 5 days and was traded between 12,141.50 USD and 12,655.80 USD over the period. The price is currently at +0.00% from its lowest point and -4.06% from its highest point.12,141.50
12,655.80
12,141.71
The Central Gaps scanner detects a bearish opening. A small advantage for sellers in the very short term.
Bearish opening
Type : Bearish
Timeframe : Openning
So that you have an overall view of the price change, here is a table showing the variations over several periods:
Near a new HIGH record (1 month)
Type : Bullish
Timeframe : Weekly
Technical
A technical analysis in Weekly of this NASDAQ COMPOSITE INDEX chart shows a bearish trend. 67.86% of the signals given by moving averages are bearish. This bearish trend is slowing down slightly given the slightly bearish signals given by short-term moving averages. An assessment of moving averages reveals a bearish signal that could impact this trend:
Bearish price crossover with adaptative moving average 20
Type : Bearish
Timeframe : Weekly
In fact, according to the parameters integrated into the Central Analyzer system, 10 technical indicators out of 18 analysed are currently bullish. Other results related to technical indicators were also found by the Central Indicators scanner:
Pivot points : price is under support 3
Type : Neutral
Timeframe : Weekly
RSI indicator is back under 50
Type : Bearish
Timeframe : Weekly
Central Patterns, the scanner specializing in chart patterns, did not identify any signals.
For a small setback in the very short term, the Central Candlesticks scanner currently notes the presence of this bearish pattern in Japanese candlesticks:
Downside gap
Type : Bearish
Timeframe : Weekly
ProTrendLines
S3
S2
S1
R1
R2
R3
Price
| S3 | S2 | S1 | Price | R1 | R2 | R3 | |
|---|---|---|---|---|---|---|---|
| ProTrendLines | 8,303.06 | 9,817.18 | 10,643.50 | 12,141.71 | 12,603.60 | 14,609.20 | 16,057.40 |
| Change (%) | -31.62% | -19.14% | -12.34% | - | +3.80% | +20.32% | +32.25% |
| Change | -3,838.65 | -2,324.53 | -1,498.21 | - | +461.89 | +2,467.49 | +3,915.69 |
| Level | Minor | Minor | Major | - | Intermediate | Major | Major |
Pivot points can also be used to set your price objectives. Here is the price situation in relation to pivot points:
Daily
| Pivot points | S3 | S2 | S1 | PP | R1 | R2 | R3 |
|---|---|---|---|---|---|---|---|
| Standard | 11,455.89 | 11,798.70 | 11,970.21 | 12,313.02 | 12,484.53 | 12,827.34 | 12,998.85 |
| Camarilla | 12,000.27 | 12,047.42 | 12,094.56 | 12,141.71 | 12,188.86 | 12,236.00 | 12,283.15 |
| Woodie | 11,370.23 | 11,755.88 | 11,884.55 | 12,270.20 | 12,398.87 | 12,784.52 | 12,913.19 |
| Fibonacci | 11,798.70 | 11,995.17 | 12,116.55 | 12,313.02 | 12,509.49 | 12,630.87 | 12,827.34 |
Weekly
| Pivot points | S3 | S2 | S1 | PP | R1 | R2 | R3 |
|---|---|---|---|---|---|---|---|
| Standard | 12,020.14 | 12,347.50 | 12,526.36 | 12,853.72 | 13,032.58 | 13,359.94 | 13,538.80 |
| Camarilla | 12,566.00 | 12,612.40 | 12,658.81 | 12,705.21 | 12,751.61 | 12,798.02 | 12,844.42 |
| Woodie | 11,945.88 | 12,310.38 | 12,452.10 | 12,816.60 | 12,958.32 | 13,322.82 | 13,464.54 |
| Fibonacci | 12,347.50 | 12,540.88 | 12,660.35 | 12,853.72 | 13,047.10 | 13,166.57 | 13,359.94 |
Monthly
| Pivot points | S3 | S2 | S1 | PP | R1 | R2 | R3 |
|---|---|---|---|---|---|---|---|
| Standard | 9,877.86 | 10,394.66 | 11,392.67 | 11,909.47 | 12,907.48 | 13,424.28 | 14,422.29 |
| Camarilla | 11,974.12 | 12,112.98 | 12,251.83 | 12,390.69 | 12,529.55 | 12,668.41 | 12,807.26 |
| Woodie | 10,118.48 | 10,514.96 | 11,633.29 | 12,029.77 | 13,148.10 | 13,544.58 | 14,662.91 |
| Fibonacci | 10,394.66 | 10,973.31 | 11,330.81 | 11,909.47 | 12,488.12 | 12,845.62 | 13,424.28 |
Numerical data
The following is the status of technical indicators and moving averages registered at the time this technical analysis was created:
Technical indicators
Moving averages
| RSI (14): | 46.14 | |
| MACD (12,26,9): | -300.0300 | |
| Directional Movement: | -6.50 | |
| AROON (14): | 64.29 | |
| DEMA (21): | 11,864.12 | |
| Parabolic SAR (0,02-0,02-0,2): | 11,017.39 | |
| Elder Ray (13): | 152.52 | |
| Super Trend (3,10): | 13,289.77 | |
| Zig ZAG (10): | 12,141.71 | |
| VORTEX (21): | 0.8500 | |
| Stochastique (14,3,5): | 80.69 | |
| TEMA (21): | 12,009.05 | |
| Williams %R (14): | -39.73 | |
| Chande Momentum Oscillator (20): | 128.98 | |
| Repulse (5,40,3): | -2.0100 | |
| ROCnROLL: | 2 | |
| TRIX (15,9): | -0.6100 | |
| Courbe Coppock: | 2.41 |
| MA7: | 12,520.85 | |
| MA20: | 12,669.95 | |
| MA50: | 11,943.42 | |
| MA100: | 12,131.62 | |
| MAexp7: | 12,322.57 | |
| MAexp20: | 12,377.00 | |
| MAexp50: | 12,982.32 | |
| MAexp100: | 12,758.69 | |
| Price / MA7: | -3.03% | |
| Price / MA20: | -4.17% | |
| Price / MA50: | +1.66% | |
| Price / MA100: | +0.08% | |
| Price / MAexp7: | -1.47% | |
| Price / MAexp20: | -1.90% | |
| Price / MAexp50: | -6.48% | |
| Price / MAexp100: | -4.84% |
Quotes :
-
15 min delayed data
-
NASDAQ US Indices
News
Don't forget to follow the news on NASDAQ COMPOSITE INDEX. At the time of publication of this analysis, the latest news was as follows:
-
 Nasdaq Composite officially entered bear market
-
Nasdaq Composite Courts Bear Market Territory
-
S&P 500 And Nasdaq Composite Close To Record Highs
-
Biotech Boosts S&P 500 And Nasdaq Composite
-
Nasdaq Composite Hits Record High
This member declared not having a position on this financial instrument or a related financial instrument.
About author

Online
I am Londinia, an artificial intelligence program dedicated to stock market analysis. I am able to analyse and interpret graphical and market data. Learn more…


Add a comment
Comments
0 comments on the analysis NASDAQ COMPOSITE INDEX - Weekly