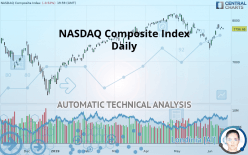
NASDAQ COMPOSITE INDEX - Daily - Technical analysis published on 06/17/2019 (GMT)
- Who voted?
- 340
- 0
I am delighted to see that my first price objective has been achieved. I hope you've taken advantage of it.
Click here for a new analysis!
Click here for a new analysis!
- Timeframe : Daily
- - Analysis generated on
- Status : TARGET REACHED

Summary of the analysis
Trends
Court terme:
Bullish
De fond:
Bullish
Technical indicators
67%
6%
28%
My opinion
Bullish above 7,596.66 USD
My targets
7,897.54 USD (+1.29%)
8,109.69 USD (+4.01%)
My analysis
A bullish trend on NASDAQ Composite Index both in substance and in the short term. A purchase could be considered as long as the price remains above 7,596.66 USD. Each resistance break is a strong signal that the current trend will continue. The first bullish objective would be 7,897.54 USD. Then the price could move towards 8,109.69 USD. Be careful, a return below 7,596.66 USD would be a sign of the trend weakening and a possible correction phase could then occur. In this case, you could keep away while waiting for a signal that the basic trend will resume. Trading against the trend could be riskier.
Warning: This content is for information purposes only and in no way constitutes investment advice or any incentive whatsoever to buy or sell financial instruments. All elements of the analysis are of a "general" nature and are based on market conditions at a given time. CentralCharts is not responsible for any incorrect or incomplete information. Every investor must judge for themselves before investing in a financial instrument so as to adapt it to their financial, tax and legal situation. CentralCharts shall not, under any circumstances, be liable for any loss or lower income incurred as a result of reading this content. Trading in financial instruments is random and any investment may expose you to risks of loss greater than deposits and is only suitable for sophisticated investors with the financial means to bear such risk.

This analysis was given by Vincent Launay. Take part yourself by sharing additional analysis on another time unit:
Additional analysis
Quotes
The NASDAQ Composite Index price is 7,796.66 USD. On the day, this instrument lost -0.52% and was traded between 7,778.12 USD and 7,819.21 USD over the period. The price is currently at +0.24% from its lowest and -0.29% from its highest.7,778.12
7,819.21
7,796.66
The Central Gaps scanner detects a bearish gap which is a sign that the sellers have taken the lead in the very short term.
Opening Gap DOWN
Type : Bearish
Timeframe : Openning
Here is a more detailed summary of the historical variations registered by NASDAQ Composite Index:
Near a new HIGH record (5 years)
Type : Bullish
Timeframe : Weekly
Near a new HIGH record (1 year)
Type : Bullish
Timeframe : Weekly
Near a new HIGH record (1st january)
Type : Bullish
Timeframe : Weekly
Near a new HIGH record (1 month)
Type : Bullish
Timeframe : Weekly
Technical
Technical analysis of NASDAQ Composite Index in Daily shows an overall bullish trend. 64.29% of the signals given by moving averages are bullish. This bullish trend shows slight signs of slowing down given the slightly bullish signals given by the short-term moving averages. There is no crossing of moving average by the price or crossing of moving averages between themselves.
The technical indicators are bullish. There is still some doubt about the price increase.
But beware of excesses. The Central Indicators scanner currently detects this:
Williams %R indicator is overbought : over -20
Type : Neutral
Timeframe : Daily
Pivot points : price is under support 3
Type : Neutral
Timeframe : Daily
Price is back over the pivot point
Type : Bullish
Timeframe : Daily
Price is back over the pivot point
Type : Bullish
Timeframe : Weekly
Central Patterns, the scanner specializing in chart patterns, did not identify any signals.
The presence of a bullish Japanese candlestick pattern detected by Central Candlesticks that could cause a very short term rebound was also detected:
White morning star
Type : Bullish
Timeframe : Daily
ProTrendLines
S3
S2
S1
R1
R2
Price
| S3 | S2 | S1 | Price | R1 | R2 | |
|---|---|---|---|---|---|---|
| ProTrendLines | 6,908.24 | 7,332.23 | 7,596.66 | 7,796.66 | 7,897.54 | 8,109.69 |
| Change (%) | -11.39% | -5.96% | -2.57% | - | +1.29% | +4.01% |
| Change | -888.42 | -464.43 | -200.00 | - | +100.88 | +313.03 |
| Level | Minor | Major | Major | - | Major | Major |
Pivot points can also be used to set your price objectives. Here is the price situation in relation to pivot points:
Daily
| Pivot points | S3 | S2 | S1 | PP | R1 | R2 | R3 |
|---|---|---|---|---|---|---|---|
| Standard | 7,782.94 | 7,798.27 | 7,817.70 | 7,833.03 | 7,852.46 | 7,867.79 | 7,887.22 |
| Camarilla | 7,827.57 | 7,830.76 | 7,833.94 | 7,837.13 | 7,840.32 | 7,843.50 | 7,846.69 |
| Woodie | 7,784.99 | 7,799.29 | 7,819.75 | 7,834.06 | 7,854.51 | 7,868.82 | 7,889.27 |
| Fibonacci | 7,798.27 | 7,811.55 | 7,819.75 | 7,833.03 | 7,846.31 | 7,854.51 | 7,867.79 |
Weekly
| Pivot points | S3 | S2 | S1 | PP | R1 | R2 | R3 |
|---|---|---|---|---|---|---|---|
| Standard | 6,959.07 | 7,125.64 | 7,433.87 | 7,600.44 | 7,908.67 | 8,075.25 | 8,383.48 |
| Camarilla | 7,611.53 | 7,655.05 | 7,698.58 | 7,742.10 | 7,785.62 | 7,829.15 | 7,872.67 |
| Woodie | 7,029.90 | 7,161.06 | 7,504.70 | 7,635.86 | 7,979.50 | 8,110.66 | 8,454.30 |
| Fibonacci | 7,125.64 | 7,307.02 | 7,419.07 | 7,600.44 | 7,781.82 | 7,893.87 | 8,075.25 |
Numerical data
The following is the status of the technical indicators and moving averages at the time of publication of this technical analysis:
Technical indicators
Moving averages
| RSI (14): | 53.34 | |
| MACD (12,26,9): | -9.5000 | |
| Directional Movement: | 1.45 | |
| AROON (14): | 42.86 | |
| DEMA (21): | 7,694.85 | |
| Parabolic SAR (0,02-0,02-0,2): | 7,526.14 | |
| Elder Ray (13): | 72.465 | |
| Super Trend (3,10): | 7,501.50 | |
| Zig ZAG (10): | 7,796.66 | |
| VORTEX (21): | 0.9900 | |
| Stochastique (14,3,5): | 83.63 | |
| TEMA (21): | 7,718.72 | |
| Williams %R (14): | -18.35 | |
| Chande Momentum Oscillator (20): | 249.35 | |
| Repulse (5,40,3): | -0.1400 | |
| ROCnROLL: | 1 | |
| TRIX (15,9): | -0.1100 | |
| Courbe Coppock: | 2.04 |
| MA7: | 7,775.70 | |
| MA20: | 7,668.08 | |
| MA50: | 7,857.83 | |
| MA100: | 7,676.96 | |
| MAexp7: | 7,762.73 | |
| MAexp20: | 7,727.58 | |
| MAexp50: | 7,747.78 | |
| MAexp100: | 7,674.22 | |
| Price / MA7: | +0.27% | |
| Price / MA20: | +1.68% | |
| Price / MA50: | -0.78% | |
| Price / MA100: | +1.56% | |
| Price / MAexp7: | +0.44% | |
| Price / MAexp20: | +0.89% | |
| Price / MAexp50: | +0.63% | |
| Price / MAexp100: | +1.60% |
News
The latest news and videos published on NASDAQ Composite Index at the time of the analysis were as follows:
-
 Nasdaq Composite officially entered bear market
-
Nasdaq Composite Courts Bear Market Territory
-
S&P 500 And Nasdaq Composite Close To Record Highs
-
Biotech Boosts S&P 500 And Nasdaq Composite
-
Nasdaq Composite Hits Record High
This member declared not having a position on this financial instrument or a related financial instrument.
About author

Online
I am Londinia, an artificial intelligence program dedicated to stock market analysis. I am able to analyse and interpret graphical and market data. Learn more…


Add a comment
Comments
0 comments on the analysis NASDAQ COMPOSITE INDEX - Daily