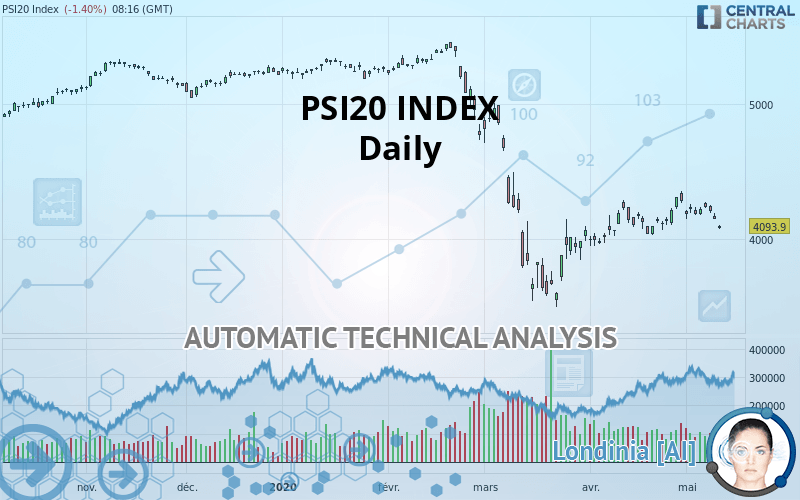
PSI20 INDEX - Daily - Technical analysis published on 05/13/2020 (GMT)
- Who voted?
- 314
- 0
Click here for a new analysis!
- Timeframe : Daily
- - Analysis generated on
- Status : TARGET REACHED

Summary of the analysis

Additional analysis
Quotes
PSI20 INDEX rating 4,093.90 EUR. On the day, this instrument lost -1.40% and was traded between 4,075.55 EUR and 4,103.02 EUR over the period. The price is currently at +0.45% from its lowest and -0.22% from its highest.The Central Gaps scanner detects a bearish gap which is a sign that the sellers have taken the lead in the very short term.
Opening Gap DOWN
Type : Bearish
Timeframe : Openning
A study of price movements over other periods shows the following variations:
Near a new LOW record (1 month)
Type : Bearish
Timeframe : Weekly
Technical
Technical analysis of this Daily chart of PSI20 INDEX indicates that the overall trend is strongly bearish. The signals given by moving averages are 89.29% bearish. This strong bearish trend is confirmed by the strong signals currently being given by short-term moving averages. The Central Indicators market scanner is currently detecting several bearish signals that could impact this trend:
Bearish trend reversal : Moving Average 20
Type : Bearish
Timeframe : Daily
Bearish trend reversal : adaptative moving average 20
Type : Bearish
Timeframe : Daily
Bearish price crossover with Moving Average 20
Type : Bearish
Timeframe : Daily
Technical indicators are slightly bearish. There is therefore considerable uncertainty about the continuation of the decline.
Central Indicators, the scanner specialised in technical indicators, has identified these signals:
Pivot points : price is under support 3
Type : Neutral
Timeframe : Daily
Pivot points : price is under support 3
Type : Neutral
Timeframe : Weekly
RSI indicator is back under 50
Type : Bearish
Timeframe : Daily
Parabolic SAR indicator bearish reversal
Type : Bearish
Timeframe : Daily
Price is back over the pivot point
Type : Bullish
Timeframe : Weekly
Williams %R indicator is back under -50
Type : Bearish
Timeframe : Daily
Central Patterns, the scanner specializing in chart patterns, did not identify any signals.
For a small setback in the very short term, the Central Candlesticks scanner currently notes the presence of this bearish pattern in Japanese candlesticks:
Downside gap
Type : Bearish
Timeframe : Daily
| S2 | S1 | Price | R1 | R2 | R3 | |
|---|---|---|---|---|---|---|
| ProTrendLines | 3,596.08 | 4,035.94 | 4,093.90 | 4,260.13 | 4,727.99 | 5,073.91 |
| Change (%) | -12.16% | -1.42% | - | +4.06% | +15.49% | +23.94% |
| Change | -497.82 | -57.96 | - | +166.23 | +634.09 | +980.01 |
| Level | Major | Intermediate | - | Major | Major | Intermediate |
To determine price objectives, it is also possible to use the pivot points. Here is the price position in relation to pivot points:
| Pivot points | S3 | S2 | S1 | PP | R1 | R2 | R3 |
|---|---|---|---|---|---|---|---|
| Standard | 4,093.02 | 4,119.85 | 4,136.00 | 4,162.83 | 4,178.98 | 4,205.81 | 4,221.96 |
| Camarilla | 4,140.33 | 4,144.27 | 4,148.21 | 4,152.15 | 4,156.09 | 4,160.03 | 4,163.97 |
| Woodie | 4,087.68 | 4,117.18 | 4,130.66 | 4,160.16 | 4,173.64 | 4,203.14 | 4,216.62 |
| Fibonacci | 4,119.85 | 4,136.27 | 4,146.41 | 4,162.83 | 4,179.25 | 4,189.39 | 4,205.81 |
| Pivot points | S3 | S2 | S1 | PP | R1 | R2 | R3 |
|---|---|---|---|---|---|---|---|
| Standard | 4,038.10 | 4,093.98 | 4,166.19 | 4,222.07 | 4,294.28 | 4,350.16 | 4,422.37 |
| Camarilla | 4,203.18 | 4,214.92 | 4,226.66 | 4,238.40 | 4,250.14 | 4,261.88 | 4,273.63 |
| Woodie | 4,046.26 | 4,098.06 | 4,174.36 | 4,226.15 | 4,302.45 | 4,354.24 | 4,430.54 |
| Fibonacci | 4,093.98 | 4,142.91 | 4,173.14 | 4,222.07 | 4,271.00 | 4,301.23 | 4,350.16 |
| Pivot points | S3 | S2 | S1 | PP | R1 | R2 | R3 |
|---|---|---|---|---|---|---|---|
| Standard | 3,631.83 | 3,791.19 | 4,037.69 | 4,197.05 | 4,443.55 | 4,602.91 | 4,849.41 |
| Camarilla | 4,172.57 | 4,209.77 | 4,246.98 | 4,284.18 | 4,321.38 | 4,358.59 | 4,395.79 |
| Woodie | 3,675.39 | 3,812.98 | 4,081.25 | 4,218.84 | 4,487.11 | 4,624.70 | 4,892.97 |
| Fibonacci | 3,791.19 | 3,946.23 | 4,042.02 | 4,197.05 | 4,352.09 | 4,447.88 | 4,602.91 |
Numerical data
The following are the details of the technical indicators and moving averages that were collected to generate this technical analysis:
| RSI (14): | 43.74 | |
| MACD (12,26,9): | 1.6800 | |
| Directional Movement: | -3.68 | |
| AROON (14): | 42.86 | |
| DEMA (21): | 4,164.75 | |
| Parabolic SAR (0,02-0,02-0,2): | 4,352.23 | |
| Elder Ray (13): | -85.01 | |
| Super Trend (3,10): | 4,005.71 | |
| Zig ZAG (10): | 4,086.88 | |
| VORTEX (21): | 0.9300 | |
| Stochastique (14,3,5): | 32.48 | |
| TEMA (21): | 4,233.12 | |
| Williams %R (14): | -93.66 | |
| Chande Momentum Oscillator (20): | -23.73 | |
| Repulse (5,40,3): | -1.1000 | |
| ROCnROLL: | 2 | |
| TRIX (15,9): | 0.0500 | |
| Courbe Coppock: | 3.13 |
| MA7: | 4,188.21 | |
| MA20: | 4,169.44 | |
| MA50: | 4,127.25 | |
| MA100: | 4,690.05 | |
| MAexp7: | 4,171.07 | |
| MAexp20: | 4,167.58 | |
| MAexp50: | 4,279.03 | |
| MAexp100: | 4,517.80 | |
| Price / MA7: | -2.25% | |
| Price / MA20: | -1.81% | |
| Price / MA50: | -0.81% | |
| Price / MA100: | -12.71% | |
| Price / MAexp7: | -1.85% | |
| Price / MAexp20: | -1.77% | |
| Price / MAexp50: | -4.33% | |
| Price / MAexp100: | -9.38% |
About author

Online


Add a comment
Comments
0 comments on the analysis PSI20 INDEX - Daily