S&P500 INDEX - Daily - Technical analysis published on 06/16/2020 (GMT)
- Who voted?
- 317
- 0
Click here for a new analysis!
- Timeframe : Daily
- - Analysis generated on
- Status : TARGET REACHED
Summary of the analysis

Additional analysis
Quotes
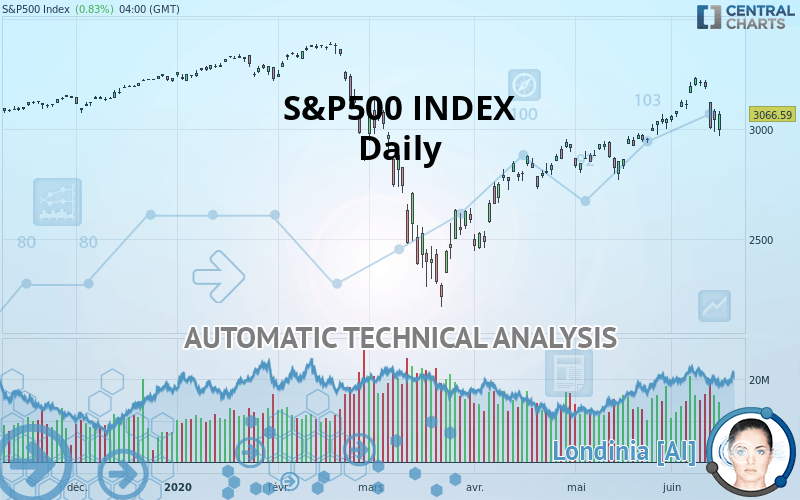
The S&P500 INDEX rating is 3,066.59 USD. The price has increased by +0.83% since the last closing and was between 2,965.66 USD and 3,079.76 USD. This implies that the price is at +3.40% from its lowest and at -0.43% from its highest.The Central Gaps scanner detects a bullish opening marking the presence of buyers ahead of sellers at the opening but not sufficiently marked to allow the price to register a quotation gap.
Bullish opening
Type : Bullish
Timeframe : Openning
So that you have an overall view of the price change, here is a table showing the variations over several periods:
Near a new HIGH record (5 years)
Type : Bullish
Timeframe : Weekly
Near a new HIGH record (1 month)
Type : Bullish
Timeframe : Weekly
Technical
Technical analysis of this Daily chart of S&P500 INDEX indicates that the overall trend is bullish. 75.00% of the signals given by moving averages are bullish. This bullish trend shows slight signs of slowing down given the slightly bullish signals given by the short-term moving averages. The Central Indicators market scanner is currently detecting several bearish signals that could impact this trend:
Bearish trend reversal : adaptative moving average 20
Type : Bearish
Timeframe : Daily
Bearish price crossover with Moving Average 20
Type : Bearish
Timeframe : Daily
Bearish price crossover with adaptative moving average 20
Type : Bearish
Timeframe : Daily
In fact, of the 18 technical indicators analysed by Central Analyzer, 4 are bullish, 9 are neutral and 5 are bearish. Central Indicators, the scanner specialised in technical indicators, has identified these signals:
Pivot points : price is under support 1
Type : Neutral
Timeframe : Weekly
RSI indicator is back under 50
Type : Bearish
Timeframe : Daily
MACD crosses DOWN its Moving Average
Type : Bearish
Timeframe : Daily
Parabolic SAR indicator bearish reversal
Type : Bearish
Timeframe : Daily
SuperTrend indicator bearish reversal
Type : Bearish
Timeframe : Daily
Price is back over the pivot point
Type : Bullish
Timeframe : Weekly
Price is back under the pivot point
Type : Bearish
Timeframe : Daily
Williams %R indicator is back under -50
Type : Bearish
Timeframe : Daily
No signals are given by Central Patterns, a market scanner specialised in chart patterns, resistances and supports.
Central Candlesticks, the scanner specialised in Japanese candlesticks, detects a bearish signal that could support the hypothesis of a small drop in the very short term:
Downside gap
Type : Bearish
Timeframe : Daily
| S3 | S2 | S1 | Price | R1 | R2 | |
|---|---|---|---|---|---|---|
| ProTrendLines | 2,470.50 | 2,581.29 | 2,930.75 | 3,066.59 | 3,225.52 | 3,386.15 |
| Change (%) | -19.44% | -15.83% | -4.43% | - | +5.18% | +10.42% |
| Change | -596.09 | -485.30 | -135.84 | - | +158.93 | +319.56 |
| Level | Minor | Intermediate | Major | - | Major | Major |
To determine price objectives, it is also possible to use the pivot points. Here is the price position in relation to pivot points:
| Pivot points | S3 | S2 | S1 | PP | R1 | R2 | R3 |
|---|---|---|---|---|---|---|---|
| Standard | 2,835.84 | 2,917.67 | 2,959.88 | 3,041.71 | 3,083.92 | 3,165.75 | 3,207.96 |
| Camarilla | 2,967.99 | 2,979.36 | 2,990.73 | 3,002.10 | 3,013.47 | 3,024.84 | 3,036.21 |
| Woodie | 2,816.04 | 2,907.77 | 2,940.08 | 3,031.81 | 3,064.12 | 3,155.85 | 3,188.16 |
| Fibonacci | 2,917.67 | 2,965.05 | 2,994.32 | 3,041.71 | 3,089.09 | 3,118.36 | 3,165.75 |
| Pivot points | S3 | S2 | S1 | PP | R1 | R2 | R3 |
|---|---|---|---|---|---|---|---|
| Standard | 2,899.56 | 2,965.55 | 3,079.74 | 3,145.73 | 3,259.92 | 3,325.91 | 3,440.10 |
| Camarilla | 3,144.38 | 3,160.90 | 3,177.41 | 3,193.93 | 3,210.45 | 3,226.96 | 3,243.48 |
| Woodie | 2,923.66 | 2,977.60 | 3,103.84 | 3,157.78 | 3,284.02 | 3,337.96 | 3,464.20 |
| Fibonacci | 2,965.55 | 3,034.38 | 3,076.90 | 3,145.73 | 3,214.56 | 3,257.08 | 3,325.91 |
| Pivot points | S3 | S2 | S1 | PP | R1 | R2 | R3 |
|---|---|---|---|---|---|---|---|
| Standard | 2,549.05 | 2,657.84 | 2,851.08 | 2,959.87 | 3,153.11 | 3,261.90 | 3,455.14 |
| Camarilla | 2,961.25 | 2,988.94 | 3,016.62 | 3,044.31 | 3,072.00 | 3,099.68 | 3,127.37 |
| Woodie | 2,591.27 | 2,678.95 | 2,893.30 | 2,980.98 | 3,195.33 | 3,283.01 | 3,497.36 |
| Fibonacci | 2,657.84 | 2,773.22 | 2,844.50 | 2,959.87 | 3,075.25 | 3,146.53 | 3,261.90 |
Numerical data
The following are the details of the technical indicators and moving averages that were collected to generate this technical analysis:
| RSI (14): | 51.72 | |
| MACD (12,26,9): | 64.7800 | |
| Directional Movement: | -5.04 | |
| AROON (14): | 71.43 | |
| DEMA (21): | 3,141.90 | |
| Parabolic SAR (0,02-0,02-0,2): | 3,228.46 | |
| Elder Ray (13): | -49.03 | |
| Super Trend (3,10): | 3,245.47 | |
| Zig ZAG (10): | 3,041.31 | |
| VORTEX (21): | 1.0200 | |
| Stochastique (14,3,5): | 45.23 | |
| TEMA (21): | 3,156.61 | |
| Williams %R (14): | -72.83 | |
| Chande Momentum Oscillator (20): | 5.18 | |
| Repulse (5,40,3): | -4.1700 | |
| ROCnROLL: | -1 | |
| TRIX (15,9): | 0.3700 | |
| Courbe Coppock: | 11.66 |
| MA7: | 3,139.91 | |
| MA20: | 3,047.84 | |
| MA50: | 2,903.24 | |
| MA100: | 2,944.99 | |
| MAexp7: | 3,101.32 | |
| MAexp20: | 3,052.14 | |
| MAexp50: | 2,962.73 | |
| MAexp100: | 2,954.39 | |
| Price / MA7: | -2.34% | |
| Price / MA20: | +0.62% | |
| Price / MA50: | +5.63% | |
| Price / MA100: | +4.13% | |
| Price / MAexp7: | -1.12% | |
| Price / MAexp20: | +0.47% | |
| Price / MAexp50: | +3.51% | |
| Price / MAexp100: | +3.80% |
News
The latest news and videos published on S&P500 INDEX at the time of the analysis were as follows:
-
 Futures turn to data to kick off new trading week, SP500 in focus
-
Futures turn to jobs, manufacturing data for direction, SP500 in focus
-
Futures look to data and earnings for direction, SP500 in focus
-
Futures turn to weekly jobs data and earnings for direction, SP500 in focus
-
US SPX 500; A sustained recovery or just a dead cat bounce?
About author

Online


Add a comment
Comments
0 comments on the analysis S&P500 INDEX - Daily