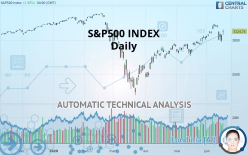
S&P500 INDEX - Daily - Technical analysis published on 06/17/2020 (GMT)
- Who voted?
- 308
- 0
Click here for a new analysis!
- Timeframe : Daily
- - Analysis generated on
- Status : TARGET REACHED

Summary of the analysis

Additional analysis
Quotes
The S&P500 INDEX rating is 3,124.74 USD. The price has increased by +1.90% since the last closing and was traded between 3,076.61 USD and 3,153.45 USD over the period. The price is currently at +1.56% from its lowest and -0.91% from its highest.So that you have an overall view of the price change, here is a table showing the variations over several periods:
Near a new HIGH record (5 years)
Type : Bullish
Timeframe : Weekly
Near a new HIGH record (1 month)
Type : Bullish
Timeframe : Weekly
Technical
Technical analysis of S&P500 INDEX in Daily shows an overall bullish trend. 78.57% of the signals given by moving averages are bullish. The overall trend is reinforced by the strong bullish signals from short-term moving averages. The Central Indicators scanner detects bullish and bearish signals on moving averages that could impact this trend:
Bearish trend reversal : adaptative moving average 20
Type : Bearish
Timeframe : Daily
Bearish price crossover with Moving Average 20
Type : Bearish
Timeframe : Daily
Bearish price crossover with adaptative moving average 20
Type : Bearish
Timeframe : Daily
Bullish price crossover with adaptative moving average 20
Type : Bullish
Timeframe : Daily
The technical indicators are generally neutral. They do not provide relevant information on the direction of future price movements.
Central Indicators, the scanner specialised in technical indicators, has identified these signals:
Pivot points : price is under support 1
Type : Neutral
Timeframe : Weekly
RSI indicator is back over 50
Type : Bullish
Timeframe : Daily
RSI indicator is back under 50
Type : Bearish
Timeframe : Daily
MACD crosses DOWN its Moving Average
Type : Bearish
Timeframe : Daily
Parabolic SAR indicator bearish reversal
Type : Bearish
Timeframe : Daily
SuperTrend indicator bearish reversal
Type : Bearish
Timeframe : Daily
Price is back over the pivot point
Type : Bullish
Timeframe : Weekly
Williams %R indicator is back under -50
Type : Bearish
Timeframe : Daily
The analysis of the price chart with Central Patterns scanners does not return any result.
The presence of a bearish pattern in Japanese candlesticks detected by Central Candlesticks that could cause a correction in the very short term was also detected:
Downside gap
Type : Bearish
Timeframe : Daily
| S3 | S2 | S1 | Price | R1 | R2 | |
|---|---|---|---|---|---|---|
| ProTrendLines | 2,581.29 | 2,930.75 | 3,095.27 | 3,124.74 | 3,225.52 | 3,386.15 |
| Change (%) | -17.39% | -6.21% | -0.94% | - | +3.23% | +8.37% |
| Change | -543.45 | -193.99 | -29.47 | - | +100.78 | +261.41 |
| Level | Intermediate | Major | Intermediate | - | Major | Major |
To determine price objectives, it is also possible to use the pivot points. Here is the price position in relation to pivot points:
| Pivot points | S3 | S2 | S1 | PP | R1 | R2 | R3 |
|---|---|---|---|---|---|---|---|
| Standard | 2,883.76 | 2,934.12 | 2,987.71 | 3,038.07 | 3,091.66 | 3,142.02 | 3,195.61 |
| Camarilla | 3,012.72 | 3,022.25 | 3,031.78 | 3,041.31 | 3,050.84 | 3,060.37 | 3,069.90 |
| Woodie | 2,885.39 | 2,934.93 | 2,989.34 | 3,038.88 | 3,093.29 | 3,142.83 | 3,197.24 |
| Fibonacci | 2,934.12 | 2,973.83 | 2,998.36 | 3,038.07 | 3,077.78 | 3,102.31 | 3,142.02 |
| Pivot points | S3 | S2 | S1 | PP | R1 | R2 | R3 |
|---|---|---|---|---|---|---|---|
| Standard | 2,899.56 | 2,965.55 | 3,079.74 | 3,145.73 | 3,259.92 | 3,325.91 | 3,440.10 |
| Camarilla | 3,144.38 | 3,160.90 | 3,177.41 | 3,193.93 | 3,210.45 | 3,226.96 | 3,243.48 |
| Woodie | 2,923.66 | 2,977.60 | 3,103.84 | 3,157.78 | 3,284.02 | 3,337.96 | 3,464.20 |
| Fibonacci | 2,965.55 | 3,034.38 | 3,076.90 | 3,145.73 | 3,214.56 | 3,257.08 | 3,325.91 |
| Pivot points | S3 | S2 | S1 | PP | R1 | R2 | R3 |
|---|---|---|---|---|---|---|---|
| Standard | 2,549.05 | 2,657.84 | 2,851.08 | 2,959.87 | 3,153.11 | 3,261.90 | 3,455.14 |
| Camarilla | 2,961.25 | 2,988.94 | 3,016.62 | 3,044.31 | 3,072.00 | 3,099.68 | 3,127.37 |
| Woodie | 2,591.27 | 2,678.95 | 2,893.30 | 2,980.98 | 3,195.33 | 3,283.01 | 3,497.36 |
| Fibonacci | 2,657.84 | 2,773.22 | 2,844.50 | 2,959.87 | 3,075.25 | 3,146.53 | 3,261.90 |
Numerical data
The following is the status of the technical indicators and moving averages at the time of publication of this technical analysis:
| RSI (14): | 53.69 | |
| MACD (12,26,9): | 58.1400 | |
| Directional Movement: | -6.35 | |
| AROON (14): | -35.71 | |
| DEMA (21): | 3,136.64 | |
| Parabolic SAR (0,02-0,02-0,2): | 3,218.70 | |
| Elder Ray (13): | -60.06 | |
| Super Trend (3,10): | 3,245.06 | |
| Zig ZAG (10): | 3,066.59 | |
| VORTEX (21): | 1.0300 | |
| Stochastique (14,3,5): | 29.26 | |
| TEMA (21): | 3,143.65 | |
| Williams %R (14): | -62.26 | |
| Chande Momentum Oscillator (20): | 36.86 | |
| Repulse (5,40,3): | 0.7100 | |
| ROCnROLL: | -1 | |
| TRIX (15,9): | 0.3600 | |
| Courbe Coppock: | 9.83 |
| MA7: | 3,133.38 | |
| MA20: | 3,057.99 | |
| MA50: | 2,914.03 | |
| MA100: | 2,942.44 | |
| MAexp7: | 3,092.64 | |
| MAexp20: | 3,053.52 | |
| MAexp50: | 2,966.81 | |
| MAexp100: | 2,956.68 | |
| Price / MA7: | -0.28% | |
| Price / MA20: | +2.18% | |
| Price / MA50: | +7.23% | |
| Price / MA100: | +6.20% | |
| Price / MAexp7: | +1.04% | |
| Price / MAexp20: | +2.33% | |
| Price / MAexp50: | +5.32% | |
| Price / MAexp100: | +5.68% |
News
The last news published on S&P500 INDEX at the time of the generation of this analysis was as follows:
-
 Futures turn to data to kick off new trading week, SP500 in focus
-
Futures turn to jobs, manufacturing data for direction, SP500 in focus
-
Futures look to data and earnings for direction, SP500 in focus
-
Futures turn to weekly jobs data and earnings for direction, SP500 in focus
-
US SPX 500; A sustained recovery or just a dead cat bounce?
About author

Online


Add a comment
Comments
0 comments on the analysis S&P500 INDEX - Daily