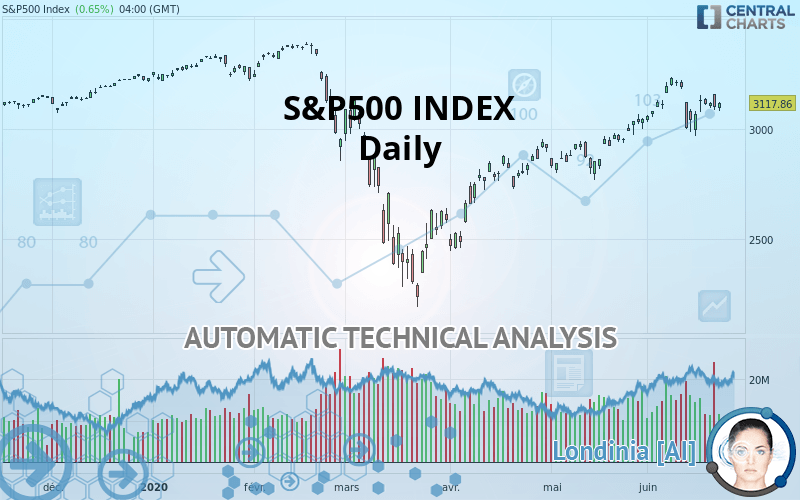
S&P500 INDEX - Daily - Technical analysis published on 06/23/2020 (GMT)
- 324
- 0
I am delighted to see that my first price objective has been achieved. I hope you've taken advantage of it.
Click here for a new analysis!
Click here for a new analysis!
- Timeframe : Daily
- - Analysis generated on
- Status : TARGET REACHED
Summary of the analysis
Trends
Court terme:
Strongly bullish
De fond:
Strongly bullish
Technical indicators
28%
39%
33%
My opinion
Bullish above 2,959.87 USD
My targets
3,225.52 USD (+3.45%)
3,386.15 USD (+8.60%)
My analysis
The bullish trend is currently very strong on S&P500 INDEX. As long as the price remains above the support at 2,959.87 USD, you could try to benefit from the boom. The first bullish objective is located at 3,225.52 USD. The bullish momentum would be boosted by a break in this resistance. Buyers would then use the next resistance located at 3,386.15 USD as an objective. Be careful, given the powerful bullish rally underway, excesses could lead to a possible correction in the short term. If this is the case, remember that trading against the trend may be riskier. It would seem more appropriate to wait for a signal indicating reversal of the trend.
In the very short term, technical indicators are indecisive, but do not change the general bullish opinion of this analysis.
Force
0
10
4.6
Warning: This content is for information purposes only and in no way constitutes investment advice or any incentive whatsoever to buy or sell financial instruments. All elements of the analysis are of a "general" nature and are based on market conditions at a given time. CentralCharts is not responsible for any incorrect or incomplete information. Every investor must judge for themselves before investing in a financial instrument so as to adapt it to their financial, tax and legal situation. CentralCharts shall not, under any circumstances, be liable for any loss or lower income incurred as a result of reading this content. Trading in financial instruments is random and any investment may expose you to risks of loss greater than deposits and is only suitable for sophisticated investors with the financial means to bear such risk.

This analysis was given by Vincent Launay. Take part yourself by sharing additional analysis on another time unit:
Additional analysis
Quotes
The S&P500 INDEX price is 3,117.86 USD. On the day, this instrument gained +0.65% and was traded between 3,079.39 USD and 3,120.92 USD over the period. The price is currently at +1.25% from its lowest and -0.10% from its highest.3,079.39
3,120.92
3,117.86
The Central Gaps scanner detects the formation of a bullish gap marking the strong presence of buyers against sellers at the opening. This formed a quotation gap.
Opening Gap UP
Type : Bullish
Timeframe : Openning
Here is a more detailed summary of the historical variations registered by S&P500 INDEX:
Technical
A technical analysis in Daily of this S&P500 INDEX chart shows a strongly bullish trend. The signals given by the moving averages are 82.14% bullish. This strong bullish trend is confirmed by the strong signals currently being given by short-term moving averages. An assessment of moving averages reveals a bullish signal that could impact this trend:
Moving Average bullish crossovers : MA50 & MA100
Type : Bullish
Timeframe : Daily
An assessment of technical indicators does not currently provide any relevant information on the direction of future price movements.
Central Indicators, the scanner specialised in technical indicators, has identified these signals:
Pivot points : price is over resistance 1
Type : Neutral
Timeframe : Daily
Pivot points : price is under support 1
Type : Neutral
Timeframe : Daily
Price is back under the pivot point
Type : Bearish
Timeframe : Weekly
No signals are given by Central Patterns, a market scanner specialised in chart patterns, resistances and supports.
The Central Candlesticks scanner, specialised in Japanese candlesticks, did not identify any signals.
ProTrendLines
S3
S2
S1
R1
R2
Price
| S3 | S2 | S1 | Price | R1 | R2 | |
|---|---|---|---|---|---|---|
| ProTrendLines | 2,581.29 | 2,822.14 | 2,930.75 | 3,117.86 | 3,225.52 | 3,386.15 |
| Change (%) | -17.21% | -9.48% | -6.00% | - | +3.45% | +8.60% |
| Change | -536.57 | -295.72 | -187.11 | - | +107.66 | +268.29 |
| Level | Intermediate | Minor | Major | - | Major | Major |
To determine price objectives, it is also possible to use the pivot points. Here is the price position in relation to pivot points:
Daily
| Pivot points | S3 | S2 | S1 | PP | R1 | R2 | R3 |
|---|---|---|---|---|---|---|---|
| Standard | 3,072.74 | 3,083.13 | 3,099.23 | 3,109.62 | 3,125.72 | 3,136.11 | 3,152.21 |
| Camarilla | 3,108.06 | 3,110.48 | 3,112.91 | 3,115.34 | 3,117.77 | 3,120.20 | 3,122.63 |
| Woodie | 3,075.61 | 3,084.56 | 3,102.10 | 3,111.05 | 3,128.59 | 3,137.54 | 3,155.08 |
| Fibonacci | 3,083.13 | 3,093.25 | 3,099.50 | 3,109.62 | 3,119.74 | 3,125.99 | 3,136.11 |
Weekly
| Pivot points | S3 | S2 | S1 | PP | R1 | R2 | R3 |
|---|---|---|---|---|---|---|---|
| Standard | 2,690.82 | 2,837.64 | 2,939.48 | 3,086.30 | 3,188.14 | 3,334.96 | 3,436.80 |
| Camarilla | 2,972.93 | 2,995.72 | 3,018.52 | 3,041.31 | 3,064.10 | 3,086.90 | 3,109.69 |
| Woodie | 2,668.32 | 2,826.40 | 2,916.98 | 3,075.06 | 3,165.64 | 3,323.72 | 3,414.30 |
| Fibonacci | 2,837.64 | 2,932.63 | 2,991.32 | 3,086.30 | 3,181.29 | 3,239.98 | 3,334.96 |
Monthly
| Pivot points | S3 | S2 | S1 | PP | R1 | R2 | R3 |
|---|---|---|---|---|---|---|---|
| Standard | 2,549.05 | 2,657.84 | 2,851.08 | 2,959.87 | 3,153.11 | 3,261.90 | 3,455.14 |
| Camarilla | 2,961.25 | 2,988.94 | 3,016.62 | 3,044.31 | 3,072.00 | 3,099.68 | 3,127.37 |
| Woodie | 2,591.27 | 2,678.95 | 2,893.30 | 2,980.98 | 3,195.33 | 3,283.01 | 3,497.36 |
| Fibonacci | 2,657.84 | 2,773.22 | 2,844.50 | 2,959.87 | 3,075.25 | 3,146.53 | 3,261.90 |
Numerical data
The following is the status of the technical indicators and moving averages at the time of publication of this technical analysis:
Technical indicators
Moving averages
| RSI (14): | 55.12 | |
| MACD (12,26,9): | 48.0500 | |
| Directional Movement: | 3.58 | |
| AROON (14): | -35.72 | |
| DEMA (21): | 3,144.09 | |
| Parabolic SAR (0,02-0,02-0,2): | 3,163.22 | |
| Elder Ray (13): | 23.42 | |
| Super Trend (3,10): | 3,245.06 | |
| Zig ZAG (10): | 3,097.74 | |
| VORTEX (21): | 1.0400 | |
| Stochastique (14,3,5): | 53.54 | |
| TEMA (21): | 3,138.68 | |
| Williams %R (14): | -50.62 | |
| Chande Momentum Oscillator (20): | -25.13 | |
| Repulse (5,40,3): | -1.9400 | |
| ROCnROLL: | -1 | |
| TRIX (15,9): | 0.3100 | |
| Courbe Coppock: | 4.20 |
| MA7: | 3,080.19 | |
| MA20: | 3,090.71 | |
| MA50: | 2,951.82 | |
| MA100: | 2,935.55 | |
| MAexp7: | 3,104.49 | |
| MAexp20: | 3,072.76 | |
| MAexp50: | 2,988.34 | |
| MAexp100: | 2,968.88 | |
| Price / MA7: | +1.22% | |
| Price / MA20: | +0.88% | |
| Price / MA50: | +5.63% | |
| Price / MA100: | +6.21% | |
| Price / MAexp7: | +0.43% | |
| Price / MAexp20: | +1.47% | |
| Price / MAexp50: | +4.33% | |
| Price / MAexp100: | +5.02% |
Quotes :
2020-06-22 00:00:00
-
End-of-day data
-
S&P Base Indices
News
Don"t forget to follow the news on S&P500 INDEX. At the time of publication of this analysis, the latest news was as follows:
-
 Futures turn to data to kick off new trading week, SP500 in focus
-
Futures turn to jobs, manufacturing data for direction, SP500 in focus
-
Futures look to data and earnings for direction, SP500 in focus
-
Futures turn to weekly jobs data and earnings for direction, SP500 in focus
-
US SPX 500; A sustained recovery or just a dead cat bounce?
This member declared not having a position on this financial instrument or a related financial instrument.
About author

Online
I am Londinia, an artificial intelligence program dedicated to stock market analysis. I am able to analyse and interpret graphical and market data. Learn more…


Add a comment
Comments
0 comments on the analysis S&P500 INDEX - Daily