S&P500 INDEX - U.S Indices All-Time Record Highs - 08/12/2016 (GMT)
- Who voted?
- 817
- 0
- Timeframe : 4H
S&P500 INDEX Chart
Are you looking for opportunities in indices and forex?
DISCOVER LONDINIA OPPORTUNITIES...
DISCOVER LONDINIA OPPORTUNITIES...
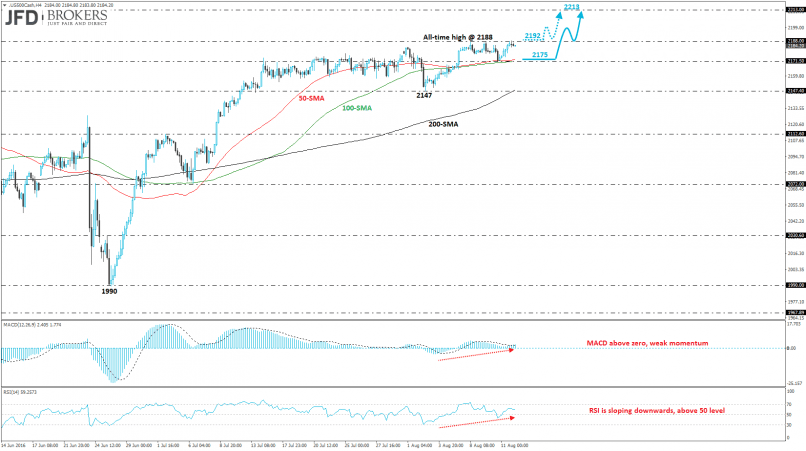
The sharp rise in the oil prices sent Wall Street stocks to hit record highs. All of the three U.S. indices ended positive creating all-time record highs for the first time since 1999. The S&P 500 gained 0.5% and topped at 2,188 with all of the index’s sectors closing positive, the only exception was the Real Estate sector that dropped 0.94%. It’s worth to mention that energy sector, that was the main driver of the U.S. indices, rose 1.47%. The Dow Jones industrial average picked up 0.64% or 117 points up at an all-time high at 18,615 while the Nasdaq composite index pulled up 0.46% or 23.81 points at 5,228, surpassing its previous high set at Tuesday's close.
From a technical point of view, the S&P 500 the last 4 weeks is moving between the 2,147 support level and the 2,188 resistance level. During yesterday’s session the index reached a fresh all-time high at 2,188 and if the price overcomes the latter level then the index will meet the 161.8% Fibonacci level of the last big downward move (June 23 high price until June 26 low price).
From a technical point of view, the S&P 500 the last 4 weeks is moving between the 2,147 support level and the 2,188 resistance level. During yesterday’s session the index reached a fresh all-time high at 2,188 and if the price overcomes the latter level then the index will meet the 161.8% Fibonacci level of the last big downward move (June 23 high price until June 26 low price).
This member did not declare if he had a position on this financial instrument or a related financial instrument.
About author

Offline


Add a comment
Comments
0 comments on the analysis S&P500 INDEX - 4H