S&P500 INDEX - Recorded Another Fresh All-Time High at 2435.82! - 06/02/2017 (GMT)
- Who voted?
- 478
- 0
- Timeframe : Daily
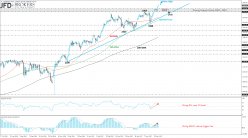
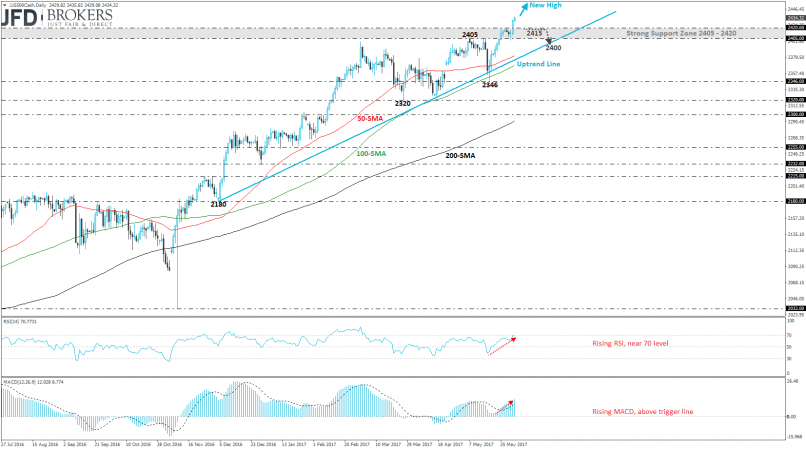
S&P500 INDEX Chart
Are you looking for opportunities in indices and forex?
DISCOVER LONDINIA OPPORTUNITIES...
DISCOVER LONDINIA OPPORTUNITIES...
The U.S. employment report will have a severe impact on the S&P 500 index as few hours before the publication of the report, the price recorded a fresh all-time high at 2435.82 following the aggressive yesterday’s run. On Thursday, the price surged more than 1% and continued the bullish tendency that is holding since November of 2016. The index completed the second green month in a row and started June with strong momentum. Despite that, in the case of downward correction, the price will hit the rising trend line, which is standing since December of 2016, near the 2405.00 support barrier.
Technical indicators on the short-term timeframe are biased higher and are strengthening. The MACD oscillator is moving above both, its zero and trigger lines suggesting a stronger index in the next few sessions. In addition, the Relative Strength Index (RSI) is following an upward path near the overbought area, confirming the recent bullish attitude of the price.
Technical indicators on the short-term timeframe are biased higher and are strengthening. The MACD oscillator is moving above both, its zero and trigger lines suggesting a stronger index in the next few sessions. In addition, the Relative Strength Index (RSI) is following an upward path near the overbought area, confirming the recent bullish attitude of the price.
This member did not declare if he had a position on this financial instrument or a related financial instrument.
About author

Offline


Add a comment
Comments
0 comments on the analysis S&P500 INDEX - Daily