S&P500 INDEX - Weak Movement the Last 6 Months - 07/03/2017 (GMT)
- Who voted?
- 616
- 0
- Timeframe : Daily
S&P500 INDEX Chart
Are you looking for opportunities in indices and forex?
DISCOVER LONDINIA OPPORTUNITIES...
DISCOVER LONDINIA OPPORTUNITIES...
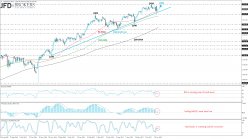
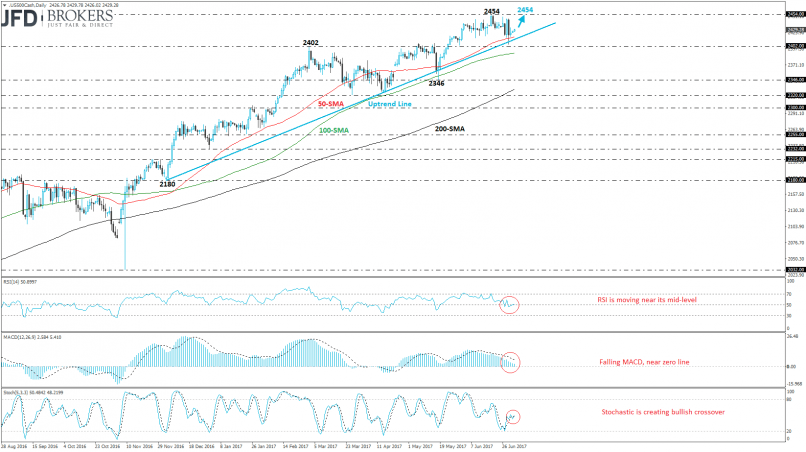
The S&P 500 index is developing within an ascending move for more than seven months climbing 10% and recording an all-time high at 2454 resistance level. Over the last six months, the price is trading within the 2402 support barrier and the 2454 barrier. The rebound on the trend line helped the price to jump slightly higher.
Technically, on the daily chart, the technical indicators seem to be confused. The Relative Strength Index (RSI) is moving near its mid-level whilst the MACD oscillator is falling near the zero line. In addition, the stochastic oscillator is trading within the 20 and 80 levels and created a bullish crossover within its moving averages and the 50-day SMA is moving slightly below the price. The next level to watch is a fresh all-time high.
Technically, on the daily chart, the technical indicators seem to be confused. The Relative Strength Index (RSI) is moving near its mid-level whilst the MACD oscillator is falling near the zero line. In addition, the stochastic oscillator is trading within the 20 and 80 levels and created a bullish crossover within its moving averages and the 50-day SMA is moving slightly below the price. The next level to watch is a fresh all-time high.
This member did not declare if he had a position on this financial instrument or a related financial instrument.
About author

Offline


Add a comment
Comments
0 comments on the analysis S&P500 INDEX - Daily