S&P500 INDEX - S&P 500 Exposed to Another New-High - Rose Almost 1% - 11/29/2017 (GMT)
- 669
- 0
- Timeframe : Daily

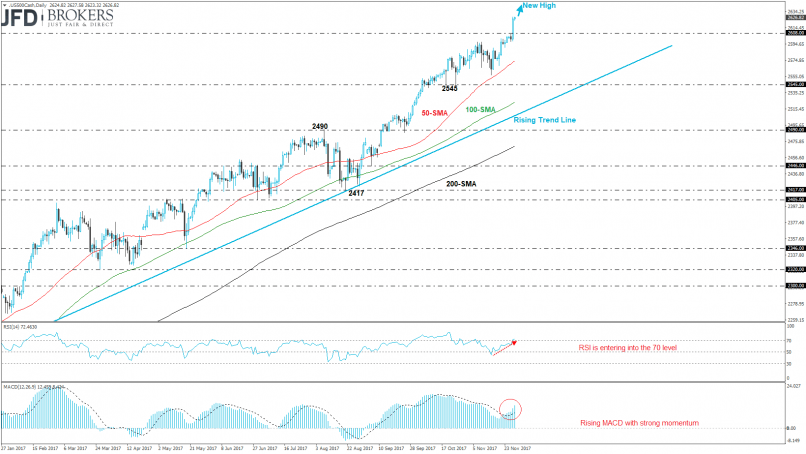
S&P500 INDEX Chart
Are you looking for opportunities in indices and forex?
DISCOVER LONDINIA OPPORTUNITIES...
DISCOVER LONDINIA OPPORTUNITIES...
The S&P 500 index posted a fresh all-time high at 2627.38 on Tuesday and soared more than 6% following the bounce off the ascending trend line in August. Currently, the index is establishing an upward tendency since December 2016 and now is extending the winning ground. This is the eighth bullish month in a row that is completing and the most probable scenario is a further bullish movement, creating a new high.On a weekly timeframe, the blue-chip index has a strong bullish behavior and the technical indicators are developing within the overbought zones. Going to the short-term chart, the indicators are also holding in extremely positive paths. The RSI indicators jumped above the 70 level and the MACD oscillator is moving above the trigger line.
This member declared not having a position on this financial instrument or a related financial instrument.
About author

Offline


Add a comment
Comments
0 comments on the analysis S&P500 INDEX - Daily