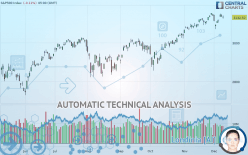
S&P500 INDEX - Daily - Technical analysis published on 12/11/2019 (GMT)
- Who voted?
- 375
- 0
Click here for a new analysis!
- Timeframe : Daily
- - Analysis generated on
- Status : TARGET REACHED

Summary of the analysis

Additional analysis
Quotes
The S&P500 INDEX rating is 3,132.52 USD. The price registered a decrease of -0.11% on the session and was traded between 3,126.09 USD and 3,142.12 USD over the period. The price is currently at +0.21% from its lowest and -0.31% from its highest.The Central Gaps scanner detects a bearish opening marking the presence of sellers ahead of buyers at the opening but not sufficiently marked to allow the price to register a quotation gap.
Bearish opening
Type : Bearish
Timeframe : Openning
So that you have an overall view of the price change, here is a table showing the variations over several periods:
Near a new HIGH record (5 years)
Type : Bullish
Timeframe : Weekly
Near a new HIGH record (1 year)
Type : Bullish
Timeframe : Weekly
Near a new HIGH record (1st january)
Type : Bullish
Timeframe : Weekly
Technical
Technical analysis of S&P500 INDEX in Daily shows a strongly overall bullish trend. 92.86% of the signals given by moving averages are bullish. The overall trend is supported by the strong bullish signals from short-term moving averages. An assessment of moving averages reveals a bullish signal that could impact this trend:
Bullish price crossover with adaptative moving average 20
Type : Bullish
Timeframe : Daily
The probability of a further increase is slight given the direction of the technical indicators.
Caution: the Central Indicators scanner currently detects an excess:
CCI indicator is overbought : over 100
Type : Neutral
Timeframe : Daily
Pivot points : price is under support 1
Type : Neutral
Timeframe : Daily
Parabolic SAR indicator bullish reversal
Type : Bullish
Timeframe : Daily
Price is back over the pivot point
Type : Bullish
Timeframe : Daily
Price is back over the pivot point
Type : Bullish
Timeframe : Weekly
Momentum indicator is back over 0
Type : Bullish
Timeframe : Daily
Central Patterns, the scanner specializing in chart patterns, did not identify any signals.
The Central Candlesticks scanner, specialised in Japanese candlesticks, did not identify any signals.
| S3 | S2 | S1 | Price | R1 | |
|---|---|---|---|---|---|
| ProTrendLines | 2,930.75 | 3,009.26 | 3,093.20 | 3,132.52 | 3,153.63 |
| Change (%) | -6.44% | -3.93% | -1.26% | - | +0.67% |
| Change | -201.77 | -123.26 | -39.32 | - | +21.11 |
| Level | Major | Intermediate | Intermediate | - | Major |
To determine price objectives, it is also possible to use the pivot points. Here is the price position in relation to pivot points:
| Pivot points | S3 | S2 | S1 | PP | R1 | R2 | R3 |
|---|---|---|---|---|---|---|---|
| Standard | 3,120.84 | 3,127.73 | 3,136.82 | 3,143.71 | 3,152.80 | 3,159.69 | 3,168.78 |
| Camarilla | 3,141.52 | 3,142.98 | 3,144.45 | 3,145.91 | 3,147.38 | 3,148.84 | 3,150.30 |
| Woodie | 3,121.94 | 3,128.28 | 3,137.92 | 3,144.26 | 3,153.90 | 3,160.24 | 3,169.88 |
| Fibonacci | 3,127.73 | 3,133.83 | 3,137.61 | 3,143.71 | 3,149.81 | 3,153.59 | 3,159.69 |
| Pivot points | S3 | S2 | S1 | PP | R1 | R2 | R3 |
|---|---|---|---|---|---|---|---|
| Standard | 3,084.04 | 3,100.74 | 3,120.86 | 3,137.56 | 3,157.68 | 3,174.38 | 3,194.50 |
| Camarilla | 3,130.85 | 3,134.23 | 3,137.61 | 3,140.98 | 3,144.36 | 3,147.73 | 3,151.11 |
| Woodie | 3,085.75 | 3,101.60 | 3,122.57 | 3,138.42 | 3,159.39 | 3,175.24 | 3,196.21 |
| Fibonacci | 3,100.74 | 3,114.81 | 3,123.50 | 3,137.56 | 3,151.63 | 3,160.32 | 3,174.38 |
| Pivot points | S3 | S2 | S1 | PP | R1 | R2 | R3 |
|---|---|---|---|---|---|---|---|
| Standard | 2,972.84 | 3,011.78 | 3,076.38 | 3,115.32 | 3,179.92 | 3,218.86 | 3,283.46 |
| Camarilla | 3,112.51 | 3,122.00 | 3,131.49 | 3,140.98 | 3,150.47 | 3,159.96 | 3,169.45 |
| Woodie | 2,985.67 | 3,018.20 | 3,089.21 | 3,121.74 | 3,192.75 | 3,225.28 | 3,296.29 |
| Fibonacci | 3,011.78 | 3,051.33 | 3,075.77 | 3,115.32 | 3,154.87 | 3,179.31 | 3,218.86 |
Numerical data
The following are the details of the technical indicators and moving averages that were collected to generate this technical analysis:
| RSI (14): | 60.58 | |
| MACD (12,26,9): | 21.5700 | |
| Directional Movement: | 11.33 | |
| AROON (14): | -21.43 | |
| DEMA (21): | 3,142.30 | |
| Parabolic SAR (0,02-0,02-0,2): | 3,071.94 | |
| Elder Ray (13): | 20.96 | |
| Super Trend (3,10): | 3,148.03 | |
| Zig ZAG (10): | 3,135.96 | |
| VORTEX (21): | 1.0300 | |
| Stochastique (14,3,5): | 74.79 | |
| TEMA (21): | 3,138.37 | |
| Williams %R (14): | -21.80 | |
| Chande Momentum Oscillator (20): | 27.50 | |
| Repulse (5,40,3): | 0.0200 | |
| ROCnROLL: | 1 | |
| TRIX (15,9): | 0.1200 | |
| Courbe Coppock: | 1.42 |
| MA7: | 3,122.87 | |
| MA20: | 3,117.12 | |
| MA50: | 3,045.61 | |
| MA100: | 2,997.22 | |
| MAexp7: | 3,127.34 | |
| MAexp20: | 3,110.89 | |
| MAexp50: | 3,064.63 | |
| MAexp100: | 3,012.84 | |
| Price / MA7: | +0.31% | |
| Price / MA20: | +0.49% | |
| Price / MA50: | +2.85% | |
| Price / MA100: | +4.51% | |
| Price / MAexp7: | +0.17% | |
| Price / MAexp20: | +0.70% | |
| Price / MAexp50: | +2.22% | |
| Price / MAexp100: | +3.97% |
News
Don"t forget to follow the news on S&P500 INDEX. At the time of publication of this analysis, the latest news was as follows:
-
 Futures flat-to-lower after Friday's rally, SP500 in focus
-
Stocks slip as data disappoints, SP500 in focus
-
Futures steady, big day for housing data, SP500 in focus
-
Futures set to rise as focus turns to economy, SP500 in focus
-
Futures set to slide ahead of Fed, SP500 in focus
About author

Online


Add a comment
Comments
0 comments on the analysis S&P500 INDEX - Daily