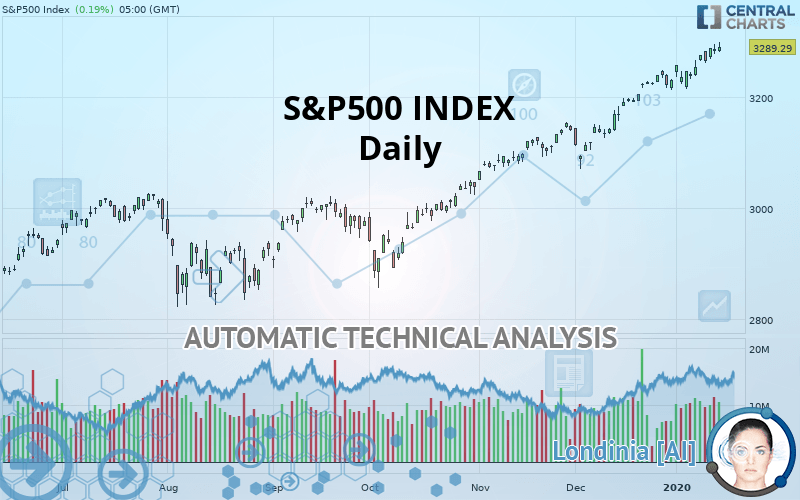
S&P500 INDEX - Daily - Technical analysis published on 01/16/2020 (GMT)
- Who voted?
- 321
- 0
Click here for a new analysis!
- Timeframe : Daily
- - Analysis generated on
- Status : TARGET REACHED

Summary of the analysis

Additional analysis
Quotes
The S&P500 INDEX rating is 3,289.29 USD. The price has increased by +0.19% since the last closing and was traded between 3,280.69 USD and 3,298.66 USD over the period. The price is currently at +0.26% from its lowest and -0.28% from its highest.The Central Gaps scanner detects a bearish opening. A small advantage for sellers in the very short term.
Bearish opening
Type : Bearish
Timeframe : Openning
A study of price movements over other periods shows the following variations:
New HIGH record (5 years)
Type : Bullish
Timeframe : Weekly
New HIGH record (1 year)
Type : Bullish
Timeframe : Weekly
New HIGH record (1st january)
Type : Bullish
Timeframe : Weekly
Near a new LOW record (1st january)
Type : Bearish
Timeframe : Weekly
New HIGH record (1 month)
Type : Bullish
Timeframe : Weekly
Near a new LOW record (1 month)
Type : Bearish
Timeframe : Weekly
Technical
Technical analysis of this Daily chart of S&P500 INDEX indicates that the overall trend is strongly bullish. 92.86% of the signals given by moving averages are bullish. This strongly bullish trend is supported by the strong bullish signals given by short-term moving averages. The Central Indicators market scanner currently does not detect any result that concerns moving averages.
Technical indicators are strongly bullish, suggesting that the price increase should continue.
Caution: the Central Indicators scanner currently detects an excess:
RSI indicator is overbought : over 70
Type : Neutral
Timeframe : Daily
CCI indicator is overbought : over 100
Type : Neutral
Timeframe : Daily
MACD indicator: bullish divergence
Type : Bullish
Timeframe : Daily
Williams %R indicator is overbought : over -20
Type : Neutral
Timeframe : Daily
Pivot points : price is over resistance 1
Type : Neutral
Timeframe : Weekly
MACD crosses UP its Moving Average
Type : Bullish
Timeframe : Daily
Price is back over the pivot point
Type : Bullish
Timeframe : Daily
Price is back under the pivot point
Type : Bearish
Timeframe : Weekly
The analysis of the price chart with Central Patterns scanners does not return any result.
The Central Candlesticks scanner which studies Japanese candlesticks did not detect anything.
| S3 | S2 | S1 | Price | |
|---|---|---|---|---|
| ProTrendLines | 3,009.26 | 3,153.63 | 3,257.85 | 3,289.29 |
| Change (%) | -8.51% | -4.12% | -0.96% | - |
| Change | -280.03 | -135.66 | -31.44 | - |
| Level | Intermediate | Major | Minor | - |
To determine price objectives, it is also possible to use the pivot points. Here is the price position in relation to pivot points:
| Pivot points | S3 | S2 | S1 | PP | R1 | R2 | R3 |
|---|---|---|---|---|---|---|---|
| Standard | 3,255.30 | 3,261.86 | 3,275.00 | 3,281.56 | 3,294.70 | 3,301.26 | 3,314.40 |
| Camarilla | 3,282.71 | 3,284.52 | 3,286.32 | 3,288.13 | 3,289.94 | 3,291.74 | 3,293.55 |
| Woodie | 3,258.58 | 3,263.51 | 3,278.28 | 3,283.21 | 3,297.98 | 3,302.91 | 3,317.68 |
| Fibonacci | 3,261.86 | 3,269.39 | 3,274.04 | 3,281.56 | 3,289.09 | 3,293.74 | 3,301.26 |
| Pivot points | S3 | S2 | S1 | PP | R1 | R2 | R3 |
|---|---|---|---|---|---|---|---|
| Standard | 3,165.76 | 3,188.90 | 3,211.87 | 3,235.01 | 3,257.98 | 3,281.12 | 3,304.09 |
| Camarilla | 3,222.17 | 3,226.40 | 3,230.62 | 3,234.85 | 3,239.08 | 3,243.30 | 3,247.53 |
| Woodie | 3,165.69 | 3,188.86 | 3,211.80 | 3,234.97 | 3,257.91 | 3,281.08 | 3,304.02 |
| Fibonacci | 3,188.90 | 3,206.51 | 3,217.39 | 3,235.01 | 3,252.62 | 3,263.50 | 3,281.12 |
| Pivot points | S3 | S2 | S1 | PP | R1 | R2 | R3 |
|---|---|---|---|---|---|---|---|
| Standard | 2,940.50 | 3,005.41 | 3,118.10 | 3,183.01 | 3,295.70 | 3,360.61 | 3,473.30 |
| Camarilla | 3,181.94 | 3,198.22 | 3,214.50 | 3,230.78 | 3,247.06 | 3,263.34 | 3,279.62 |
| Woodie | 2,964.38 | 3,017.36 | 3,141.98 | 3,194.96 | 3,319.58 | 3,372.56 | 3,497.18 |
| Fibonacci | 3,005.41 | 3,073.26 | 3,115.17 | 3,183.01 | 3,250.86 | 3,292.77 | 3,360.61 |
Numerical data
The following are the details of the technical indicators and moving averages that were collected to generate this technical analysis:
| RSI (14): | 69.58 | |
| MACD (12,26,9): | 34.9500 | |
| Directional Movement: | 22.32 | |
| AROON (14): | 64.29 | |
| DEMA (21): | 3,280.39 | |
| Parabolic SAR (0,02-0,02-0,2): | 3,227.27 | |
| Elder Ray (13): | 34.41 | |
| Super Trend (3,10): | 3,221.43 | |
| Zig ZAG (10): | 3,283.15 | |
| VORTEX (21): | 1.1800 | |
| Stochastique (14,3,5): | 87.21 | |
| TEMA (21): | 3,283.99 | |
| Williams %R (14): | -13.50 | |
| Chande Momentum Oscillator (20): | 43.24 | |
| Repulse (5,40,3): | 0.3900 | |
| ROCnROLL: | 1 | |
| TRIX (15,9): | 0.1600 | |
| Courbe Coppock: | 3.48 |
| MA7: | 3,263.98 | |
| MA20: | 3,236.08 | |
| MA50: | 3,163.01 | |
| MA100: | 3,065.37 | |
| MAexp7: | 3,267.20 | |
| MAexp20: | 3,233.53 | |
| MAexp50: | 3,168.26 | |
| MAexp100: | 3,094.42 | |
| Price / MA7: | +0.78% | |
| Price / MA20: | +1.64% | |
| Price / MA50: | +3.99% | |
| Price / MA100: | +7.30% | |
| Price / MAexp7: | +0.68% | |
| Price / MAexp20: | +1.72% | |
| Price / MAexp50: | +3.82% | |
| Price / MAexp100: | +6.30% |
News
The last news published on S&P500 INDEX at the time of the generation of this analysis was as follows:
-
 Futures remain bullish, SP500 in focus
-
Futures remain on upside to start week, SP500 in focus
-
Futures positive ahead of jobs data, SP500 in focus
-
Futures flat-to-lower after Friday's rally, SP500 in focus
-
Stocks slip as data disappoints, SP500 in focus
About author

Online


Add a comment
Comments
0 comments on the analysis S&P500 INDEX - Daily