S&P500 INDEX - US Indices Collapsed! - 08/25/2015 (GMT)
- Who voted?
- 617
- 1
- Timeframe : Weekly
S&P500 INDEX Chart
Are you looking for opportunities in indices and forex?
DISCOVER LONDINIA OPPORTUNITIES...
DISCOVER LONDINIA OPPORTUNITIES...
As the month draws to a close and investors look forward to September, everyone is wondering whether the US equites will have enough momentum to charge ahead. The 3 major US indices traded mostly lower the last few days as hopes for a rise in the benchmark interest rate by the Fed were diminished, following a dovish tone of the minutes of FOMC meeting for July as well as the problems in China are expected to have an adverse effect on the US dollar.
The S&P 500 slumped near 1000 points after the opening of the Asian session but retreated some of its losses and closed 78 points down at 1,893. The pricing of the index stopped temporarily after the losses hit the 5% limit! The next limit on the downside was 7% but have not reached yet. Monday was the fifth consecutive day the index closed the trading session in the red and its losses totaled to -10.32%.
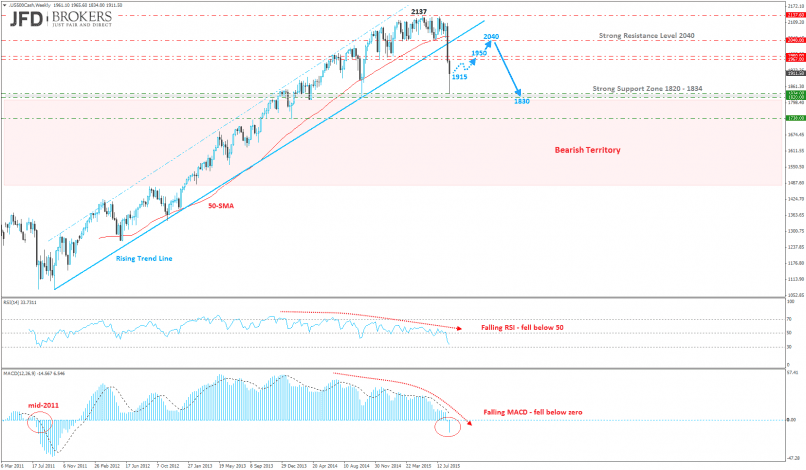
The S&P 500 index has been looking a quite weak over the past couple of days. In fact, the last few daily candles have been very bearish following several failed attempts to break above the significant resistance level of 2110. The bearish move came following the break below the key support level of 2040, which prompted a move below the ascending trend line, which started back in mid-2011. Following the break below the rising trend line, the index plunged below the psychological level of 1900, however, it gained some momentum late Monday and come back to close above the latter level, roughly around 1923.
For confirmation of the trend reversal, we’ll need to see a break below the strong support zone of 1820 – 1834. This zone provided significant support yesterday, following the aggressive sell-off below the rising trend line. Also providing support at this level is the 23.6% Fibonacci level as well as the 1900 barrier, so a break of all of these levels would strongly suggest there’s been a change of bias in the markets.
Furthermore the downward pressure, following the sharp sell-off, could continue for a little while yet, but in the short term, it looks as though we could see a push back towards that trend line, near 2040.
The S&P 500 slumped near 1000 points after the opening of the Asian session but retreated some of its losses and closed 78 points down at 1,893. The pricing of the index stopped temporarily after the losses hit the 5% limit! The next limit on the downside was 7% but have not reached yet. Monday was the fifth consecutive day the index closed the trading session in the red and its losses totaled to -10.32%.
The S&P 500 index has been looking a quite weak over the past couple of days. In fact, the last few daily candles have been very bearish following several failed attempts to break above the significant resistance level of 2110. The bearish move came following the break below the key support level of 2040, which prompted a move below the ascending trend line, which started back in mid-2011. Following the break below the rising trend line, the index plunged below the psychological level of 1900, however, it gained some momentum late Monday and come back to close above the latter level, roughly around 1923.
For confirmation of the trend reversal, we’ll need to see a break below the strong support zone of 1820 – 1834. This zone provided significant support yesterday, following the aggressive sell-off below the rising trend line. Also providing support at this level is the 23.6% Fibonacci level as well as the 1900 barrier, so a break of all of these levels would strongly suggest there’s been a change of bias in the markets.
Furthermore the downward pressure, following the sharp sell-off, could continue for a little while yet, but in the short term, it looks as though we could see a push back towards that trend line, near 2040.
This member did not declare if he had a position on this financial instrument or a related financial instrument.
About author

Offline


Add a comment
Comments
1 comments on the analysis S&P500 INDEX - Weekly