DOW JONES INDUSTRIAL AVERAGE - DJIA Climbed Above 20K - Continues Rising! - 01/26/2017 (GMT)
- Who voted?
- 722
- 0
- Timeframe : Daily

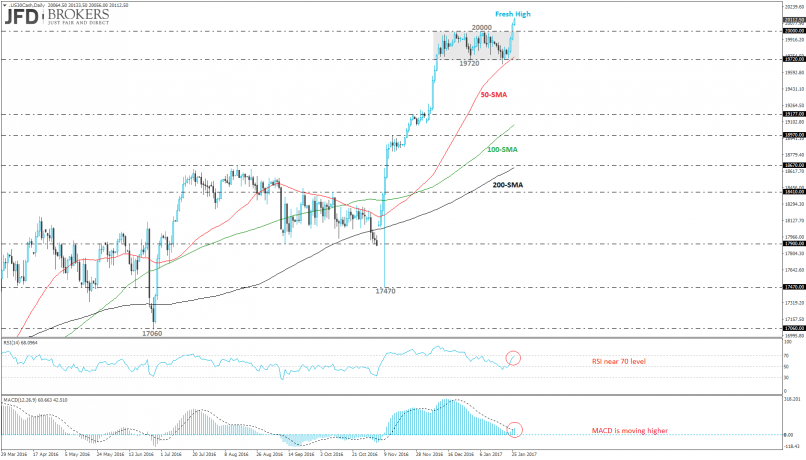
DOW JONES INDUSTRIAL AVERAGE Chart
Technically, the Dow Jones Industrial Average climbed above 20,000 for the first time after the consolidation area 19,720 – 20,000 that was holding since December 11th. The index had an aggressive run to the upside while it recorded the third positive day in a row following the rebound on the lower boundary of the sideways channel which overlaps with the 50-daily SMA.
Technical indicators are confirming the recent bullish attitude on price while our expectation is a further incline. The RSI indicator is moving higher with strong momentum and is approaching the overbought area whilst the MACD oscillator crossed its trigger line to the upside and its momentum is strengthening over the last few sessions.
Technical indicators are confirming the recent bullish attitude on price while our expectation is a further incline. The RSI indicator is moving higher with strong momentum and is approaching the overbought area whilst the MACD oscillator crossed its trigger line to the upside and its momentum is strengthening over the last few sessions.
This member did not declare if he had a position on this financial instrument or a related financial instrument.
About author

Offline


Add a comment
Comments
0 comments on the analysis DOW JONES INDUSTRIAL AVERAGE - Daily