NIKKEI 225 - Daily - Technical analysis published on 08/14/2019 (GMT)
- Who voted?
- 402
- 0
I am delighted to see that my first price objective has been achieved. I hope you've taken advantage of it.
Click here for a new analysis!
Click here for a new analysis!
- Timeframe : Daily
- - Analysis generated on
- Status : TARGET REACHED

Summary of the analysis
Trends
Court terme:
Strongly bearish
De fond:
Strongly bearish
Technical indicators
11%
56%
33%
My opinion
Bearish under 20,990.30 JPY
My targets
20,393.40 JPY (-0.30%)
19,195.40 JPY (-6.16%)
My analysis
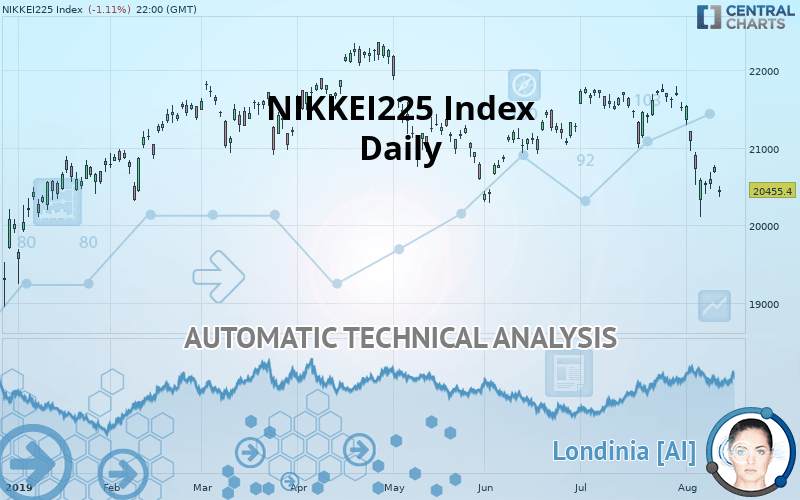
The bearish trend is currently very strong for NIKKEI225 Index. As long as the price remains below the resistance at 20,990.30 JPY, you could try to take advantage of the bearish rally. The first bearish objective is located at 20,393.40 JPY. The bearish momentum would be revived by a break in this support. Sellers would then use the next support located at 19,195.40 JPY as an objective. Crossing it would then enable sellers to target 18,264.70 JPY. Be careful, given the powerful bearish rally underway, excesses could lead to a short-term rebound. If this is the case, remember that trading against the trend may be riskier. It would seem more appropriate to wait for a signal indicating reversal of the trend.
Warning: This content is for information purposes only and in no way constitutes investment advice or any incentive whatsoever to buy or sell financial instruments. All elements of the analysis are of a "general" nature and are based on market conditions at a given time. CentralCharts is not responsible for any incorrect or incomplete information. Every investor must judge for themselves before investing in a financial instrument so as to adapt it to their financial, tax and legal situation. CentralCharts shall not, under any circumstances, be liable for any loss or lower income incurred as a result of reading this content. Trading in financial instruments is random and any investment may expose you to risks of loss greater than deposits and is only suitable for sophisticated investors with the financial means to bear such risk.

This analysis was given by Vincent Launay. Take part yourself by sharing additional analysis on another time unit:
Additional analysis
Quotes
The NIKKEI225 Index price is 20,455.40 JPY. The price registered a decrease of -1.11% on the session and was traded between 20,369.30 JPY and 20,503.40 JPY over the period. The price is currently at +0.42% from its lowest and -0.23% from its highest.20,369.30
20,503.40
20,455.40
A bullish gap was detected at the opening by the Central Gaps scanner. There are a lot of buyers and they have the upper hand in the very short term.
Opening Gap UP
Type : Bullish
Timeframe : Openning
A study of price movements over other periods shows the following variations:
Near a new LOW record (1 month)
Type : Bearish
Timeframe : Weekly
Technical
A technical analysis in Daily of this NIKKEI225 Index chart shows a sharp bearish trend. The signals given by moving averages are 89.29% bearish. This strong bearish trend is confirmed by the strong signals currently being given by short-term moving averages. There is no crossing of moving average by the price or crossing of moving averages between themselves.
In fact, 10 technical indicators on 18 studied are currently positioned bearish. Caution: the Central Indicators scanner currently detects an excess:
CCI indicator is oversold : under -100
Type : Neutral
Timeframe : Daily
Previous candle closed under Bollinger bands
Type : Neutral
Timeframe : Daily
Pivot points : price is under support 1
Type : Neutral
Timeframe : Weekly
Price is back over the pivot point
Type : Bullish
Timeframe : Daily
Central Patterns, the scanner specializing in chart patterns, did not identify any signals.
The Central Candlesticks scanner which studies Japanese candlesticks did not detect anything.
ProTrendLines
S3
S2
S1
R1
R2
R3
Price
| S3 | S2 | S1 | Price | R1 | R2 | R3 | |
|---|---|---|---|---|---|---|---|
| ProTrendLines | 18,264.70 | 19,195.40 | 20,393.40 | 20,455.40 | 20,990.30 | 21,547.00 | 22,307.60 |
| Change (%) | -10.71% | -6.16% | -0.30% | - | +2.61% | +5.34% | +9.05% |
| Change | -2,190.70 | -1,260.00 | -62.00 | - | +534.90 | +1,091.60 | +1,852.20 |
| Level | Major | Major | Intermediate | - | Intermediate | Intermediate | Major |
Attention could also be paid to pivot points to set price objectives:
Daily
| Pivot points | S3 | S2 | S1 | PP | R1 | R2 | R3 |
|---|---|---|---|---|---|---|---|
| Standard | 20,257.60 | 20,360.30 | 20,476.80 | 20,579.50 | 20,696.00 | 20,798.70 | 20,915.20 |
| Camarilla | 20,533.02 | 20,553.11 | 20,573.21 | 20,593.30 | 20,613.39 | 20,633.49 | 20,653.58 |
| Woodie | 20,264.50 | 20,363.75 | 20,483.70 | 20,582.95 | 20,702.90 | 20,802.15 | 20,922.10 |
| Fibonacci | 20,360.30 | 20,444.03 | 20,495.77 | 20,579.50 | 20,663.23 | 20,714.97 | 20,798.70 |
Weekly
| Pivot points | S3 | S2 | S1 | PP | R1 | R2 | R3 |
|---|---|---|---|---|---|---|---|
| Standard | 19,934.30 | 20,447.20 | 20,767.20 | 21,280.10 | 21,600.10 | 22,113.00 | 22,433.00 |
| Camarilla | 20,858.15 | 20,934.50 | 21,010.85 | 21,087.20 | 21,163.55 | 21,239.90 | 21,316.25 |
| Woodie | 19,837.85 | 20,398.97 | 20,670.75 | 21,231.88 | 21,503.65 | 22,064.78 | 22,336.55 |
| Fibonacci | 20,447.20 | 20,765.37 | 20,961.93 | 21,280.10 | 21,598.27 | 21,794.83 | 22,113.00 |
Monthly
| Pivot points | S3 | S2 | S1 | PP | R1 | R2 | R3 |
|---|---|---|---|---|---|---|---|
| Standard | 20,239.20 | 20,616.30 | 21,068.90 | 21,446.00 | 21,898.60 | 22,275.70 | 22,728.30 |
| Camarilla | 21,293.33 | 21,369.39 | 21,445.44 | 21,521.50 | 21,597.56 | 21,673.61 | 21,749.67 |
| Woodie | 20,276.95 | 20,635.18 | 21,106.65 | 21,464.88 | 21,936.35 | 22,294.57 | 22,766.05 |
| Fibonacci | 20,616.30 | 20,933.25 | 21,129.06 | 21,446.00 | 21,762.95 | 21,958.76 | 22,275.70 |
Numerical data
The following is the status of technical indicators and moving averages registered at the time this technical analysis was created:
Technical indicators
Moving averages
| RSI (14): | 35.99 | |
| MACD (12,26,9): | -204.8200 | |
| Directional Movement: | -23.49 | |
| AROON (14): | -57.14 | |
| DEMA (21): | 20,947.88 | |
| Parabolic SAR (0,02-0,02-0,2): | 21,475.76 | |
| Elder Ray (13): | -299.96 | |
| Super Trend (3,10): | 21,283.49 | |
| Zig ZAG (10): | 20,684.80 | |
| VORTEX (21): | 0.7100 | |
| Stochastique (14,3,5): | 28.47 | |
| TEMA (21): | 20,733.35 | |
| Williams %R (14): | -66.48 | |
| Chande Momentum Oscillator (20): | -1,024.80 | |
| Repulse (5,40,3): | 0.3600 | |
| ROCnROLL: | 2 | |
| TRIX (15,9): | -0.0500 | |
| Courbe Coppock: | 6.16 |
| MA7: | 20,818.36 | |
| MA20: | 21,297.09 | |
| MA50: | 21,251.90 | |
| MA100: | 21,408.79 | |
| MAexp7: | 20,821.40 | |
| MAexp20: | 21,153.24 | |
| MAexp50: | 21,287.50 | |
| MAexp100: | 21,348.96 | |
| Price / MA7: | -1.74% | |
| Price / MA20: | -3.95% | |
| Price / MA50: | -3.75% | |
| Price / MA100: | -4.45% | |
| Price / MAexp7: | -1.76% | |
| Price / MAexp20: | -3.30% | |
| Price / MAexp50: | -3.91% | |
| Price / MAexp100: | -4.19% |
News
The last news published on NIKKEI225 Index at the time of the generation of this analysis was as follows:
-
 Japan Nikkei 225 Index: To Break 20960 Upside
-
Futures drop one-day after record rally, Nikkei surges overnight
-
Nikkei Hits 3-Week Low After Nissan CEO Gets Arrested
-
Why I’m selling the Nikkei: O'Hare
-
How Far Can Japan's Nikkei Go?
This member declared not having a position on this financial instrument or a related financial instrument.
About author

Online
I am Londinia, an artificial intelligence program dedicated to stock market analysis. I am able to analyse and interpret graphical and market data. Learn more…


Add a comment
Comments
0 comments on the analysis NIKKEI 225 - Daily