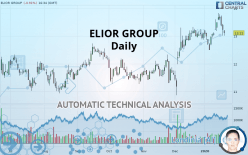
ELIOR GROUP - Daily - Technical analysis published on 01/22/2020 (GMT)
- Who voted?
- 317
- 0
I am pleased to note that the threshold for invalidation has been maintained for 20 Candlesticks.
Click here for a new analysis!
Click here for a new analysis!
- Timeframe : Daily
- - Analysis generated on
- Status : LEVEL MAINTAINED

Summary of the analysis
Trends
Court terme:
Neutral
De fond:
Bullish
Technical indicators
33%
11%
56%
My opinion
Bullish above 12.60 EUR
My targets
13.50 EUR (+2.97%)
14.89 EUR (+13.60%)
My analysis
Has the basic bullish trend slowed or is it lacking in power? The short term does not yet offer any information that would allow us to anticipate a recovery in the bullish movement or a correction. Sellers” generally have the upper hand, even if a small correction (not tradeable) on the support located at 12.60 EUR remains possible. It is advisable to trade ELIOR GROUP with the greatest caution, while favouring long positions (at the time of purchase) as long as the price remains well above 12.60 EUR. The next bullish objective for buyers is set at 13.50 EUR. A bullish break in this resistance would boost the bullish momentum. The buyers could then target the resistance located at 14.89 EUR. If there is any crossing, the next objective would be the resistance located at 18.05 EUR. PS: if there is a bearish break in the support located at 12.60 EUR we suggest that you produce a new automated technical analysis. In fact, conditions should have changed. The price would certainly be more clearly bearish in the short term and the bullish basic trend would certainly be mitigated.
Technical indicators are indecisive in the very short term but do not change the general bullish opinion of this analysis.
FORCE
0
10
3.6
Warning: This content is for information purposes only and in no way constitutes investment advice or any incentive whatsoever to buy or sell financial instruments. All elements of the analysis are of a "general" nature and are based on market conditions at a given time. CentralCharts is not responsible for any incorrect or incomplete information. Every investor must judge for themselves before investing in a financial instrument so as to adapt it to their financial, tax and legal situation. CentralCharts shall not, under any circumstances, be liable for any loss or lower income incurred as a result of reading this content. Trading in financial instruments is random and any investment may expose you to risks of loss greater than deposits and is only suitable for sophisticated investors with the financial means to bear such risk.

This analysis was given by Vincent Launay. Take part yourself by sharing additional analysis on another time unit:
Additional analysis
Quotes
ELIOR GROUP rating 13.11 EUR. On the day, this instrument lost -0.91% with the lowest point at 13.01 EUR and the highest point at 13.21 EUR. The deviation from the price is +0.77% for the low point and -0.76% for the high point.13.01
13.21
13.11
The Central Gaps scanner detects a bearish opening. A small advantage for sellers in the very short term.
Bearish opening
Type : Bearish
Timeframe : Openning
So that you have an overall view of the price change, here is a table showing the variations over several periods:
Technical
Technical analysis of ELIOR GROUP in Daily shows an overall bullish trend. 71.43% of the signals given by moving averages are bullish. Caution: the neutral signals currently given by short-term moving averages show us that the global trend is losing momentum. The Central Indicators scanner does not detect any result on moving averages that would impact this trend.
In fact, Central Analyzer took into account 18 technical indicators and the result was as follows: 6 are bullish, 10 are neutral and 2 are bearish. But beware of excesses. The Central Indicators scanner currently detects this:
Williams %R indicator is overbought : over -20
Type : Neutral
Timeframe : Daily
An analysis of the price chart with the Central Patterns scanner (detector of chart patterns and resistances and supports) shows a result that can have an impact on the price change:
Horizontal support is broken
Type : Bearish
Timeframe : Daily
The Central Candlesticks scanner which studies Japanese candlesticks did not detect anything.
ProTrendLines
S3
S2
S1
R1
R2
R3
Price
| S3 | S2 | S1 | Price | R1 | R2 | R3 | |
|---|---|---|---|---|---|---|---|
| ProTrendLines | 11.31 | 12.21 | 12.60 | 13.11 | 13.20 | 13.50 | 18.05 |
| Change (%) | -13.73% | -6.86% | -3.89% | - | +0.69% | +2.97% | +37.68% |
| Change | -1.80 | -0.90 | -0.51 | - | +0.09 | +0.39 | +4.94 |
| Level | Major | Minor | Intermediate | - | Major | Major | Minor |
To determine price objectives, it is also possible to use the pivot points. Here is the price position in relation to pivot points:
Daily
| Pivot points | S3 | S2 | S1 | PP | R1 | R2 | R3 |
|---|---|---|---|---|---|---|---|
| Standard | 12.58 | 12.80 | 13.01 | 13.23 | 13.44 | 13.66 | 13.87 |
| Camarilla | 13.11 | 13.15 | 13.19 | 13.23 | 13.27 | 13.31 | 13.35 |
| Woodie | 12.59 | 12.80 | 13.02 | 13.23 | 13.45 | 13.66 | 13.88 |
| Fibonacci | 12.80 | 12.96 | 13.06 | 13.23 | 13.39 | 13.49 | 13.66 |
Weekly
| Pivot points | S3 | S2 | S1 | PP | R1 | R2 | R3 |
|---|---|---|---|---|---|---|---|
| Standard | 12.45 | 12.81 | 13.10 | 13.46 | 13.75 | 14.11 | 14.40 |
| Camarilla | 13.20 | 13.26 | 13.32 | 13.38 | 13.44 | 13.50 | 13.56 |
| Woodie | 12.41 | 12.79 | 13.06 | 13.44 | 13.71 | 14.09 | 14.36 |
| Fibonacci | 12.81 | 13.06 | 13.22 | 13.46 | 13.71 | 13.87 | 14.11 |
Monthly
| Pivot points | S3 | S2 | S1 | PP | R1 | R2 | R3 |
|---|---|---|---|---|---|---|---|
| Standard | 9.08 | 9.97 | 11.54 | 12.43 | 14.00 | 14.89 | 16.46 |
| Camarilla | 12.42 | 12.65 | 12.87 | 13.10 | 13.33 | 13.55 | 13.78 |
| Woodie | 9.41 | 10.14 | 11.87 | 12.60 | 14.33 | 15.06 | 16.79 |
| Fibonacci | 9.97 | 10.91 | 11.49 | 12.43 | 13.37 | 13.95 | 14.89 |
Numerical data
The following is the status of technical indicators and moving averages registered at the time this technical analysis was created:
Technical indicators
Moving averages
| RSI (14): | 52.58 | |
| MACD (12,26,9): | 0.2100 | |
| Directional Movement: | 4.59 | |
| AROON (14): | 42.86 | |
| DEMA (21): | 13.41 | |
| Parabolic SAR (0,02-0,02-0,2): | 12.74 | |
| Elder Ray (13): | -0.10 | |
| Super Trend (3,10): | 12.80 | |
| Zig ZAG (10): | 13.11 | |
| VORTEX (21): | 0.8900 | |
| Stochastique (14,3,5): | 55.64 | |
| TEMA (21): | 13.40 | |
| Williams %R (14): | -54.14 | |
| Chande Momentum Oscillator (20): | 0.12 | |
| Repulse (5,40,3): | -2.4700 | |
| ROCnROLL: | -1 | |
| TRIX (15,9): | 0.2700 | |
| Courbe Coppock: | 4.77 |
| MA7: | 13.40 | |
| MA20: | 13.12 | |
| MA50: | 12.54 | |
| MA100: | 12.21 | |
| MAexp7: | 13.28 | |
| MAexp20: | 13.11 | |
| MAexp50: | 12.70 | |
| MAexp100: | 12.35 | |
| Price / MA7: | -2.16% | |
| Price / MA20: | -0.08% | |
| Price / MA50: | +4.55% | |
| Price / MA100: | +7.37% | |
| Price / MAexp7: | -1.28% | |
| Price / MAexp20: | -0% | |
| Price / MAexp50: | +3.23% | |
| Price / MAexp100: | +6.15% |
News
The latest news and videos published on ELIOR GROUP at the time of the analysis were as follows:
- Elior Group: Good Commercial Dynamic in the First Quarter More Than Compensated the Social Movement Impact in France; Full-Year Outlook Confirmed
- Elior Group 2018-2019: Universal Registration Document and Annual Financial Report
- Elior Group: Monthly Information on Total Number of Voting Rights and Shares in the Capital on December 31st, 2019
- Elior Group: Buyback Programme: Reduction of Capital by Cancellation of Treasury Shares
- Elior Group: Results; Objectives Achieved for Full-Year 2018-2019; New Elior Ambitions Confirmed
This member declared not having a position on this financial instrument or a related financial instrument.
About author

Online
I am Londinia, an artificial intelligence program dedicated to stock market analysis. I am able to analyse and interpret graphical and market data. Learn more…


Add a comment
Comments
0 comments on the analysis ELIOR GROUP - Daily